The 8K technology market was valued at USD 148.0 million in 2018 and is projected to reach a market value of USD 663.6 million by 2023 at a CAGR of 35.0%, during the forecast period i.e. 2018 to 2023. 8K technology market is at the emerging phase of product life-cycle. Strong demand for display panels with high resolution, fast response time, and better picture quality is expected to elevate the market growth in next couple of years. The 8K technology market is witnessing an increase in the demand from various end-use industries including healthcare & medical, entertainment and commercial industries.
8K technology market is segmented on the basis of various resolutions that include 7680 x 4320, 8192 x 4320, 8192 x 5120, and 8192 x 8192. 8K UHD at 7680 × 4320 resolution is expected to experience high demand as it is best suited for monitors and televisions. Its high pixel count enables better viewing angles and high clarity of images.
On the basis of product type, 8K technology market is segmented into TVs, displays and cameras. The technological advancements in these products have made the incorporation of the 8K technologies in these products easier. The market in camera segment is experiencing high growth owing to increasing demand from filmmakers for the 8K cameras due to its ability to capture better images. NHK the broadcasting company, for instance, in Japan, has launched its 8K SHV channels to provide 8K media on a large scale. Televisions segment is projected to grow at highest rate as it is mostly suited for 16:9 aspect ratio.
Based on application, 8K technology market is classified into healthcare & medical, electronics, FMCD industries, and others. Healthcare & medical industry is expected to account for major share considering its ability to view and differentiate between internal tissue structures from the damaged and infected one. Since the 8K imaging systems have a high pixel count, they gain more preference over the traditional imaging techniques.
APAC accounted for the major share of the 8K technology market in 2018, and this trend is expected to continue during the forecast period. Strong demand from countries such as South Korea, China, and Japan are the major factor for APAC’s dominance in the global 8K technology market. China is expected to account for the largest share of the market during the forecast period owing to the fact that there are several 8K technology providers in the country with robust display manufacturing capabilities.
8K technology market is dominated by the presence of players such as BOE Japan Co. Ltd., Canon Inc, Dell Inc., Hisense Co. Ltd., Ikegami Tsushinki Co. Ltd., LG Electronics Inc, Panasonic Corporation, Red Digital Cinema Camera Company, Samsung Group, Sharp Corporation. These players are focusing on strengthening their presence in the 8K technology market in order to meet increasing demand from consumer electronics industry with high demand for better display screens and technological advancements in microLED.
1 8K Technology Market Overview
1.1 8K Technology Product Overview
1.2 8K Technology Segment by Types (Product Category)
1.2.1 Global 8K Technology Sales and Growth (%) Comparison by Types (2013-2025)
1.2.2 Global 8K Technology Sales Market Share (%) by Types in 2017
1.2.3 Television
1.2.4 Display
1.2.5 Camera
1.3 Global 8K Technology Segment by Resolution
1.3.1 Global 8K Technology Sales Comparison by Applications (2013-2025)
1.3.2 7680 x 4320
1.3.3 8192 x 4320
1.3.4 8192 x 5120
1.3.5 8192 x 8192
1.4 Global 8K Technology Segment by Applications
1.4.1 Global 8K Technology Sales Comparison by Applications (2014-2025)
1.4.2 Electronics
1.4.3 Healthcare & medical
1.4.4 FMCD
1.4.5 Others
1.5 Global 8K Technology Market by Regions (2013-2025)
1.5.1 Global 8K Technology Market Size and Growth (%) Comparison by Regions (2013-2025)
1.5.2 North America 8K Technology Status and Prospect (2013-2025)
1.5.3 Asia-Pacific 8K Technology Status and Prospect (2013-2025)
1.5.4 Europe 8K Technology Status and Prospect (2013-2025)
1.5.5 South America 8K Technology Status and Prospect (2013-2025)
1.5.6 Middle East and Africa 8K Technology Status and Prospect (2013-2025)
1.6 Global 8K Technology Market Size (2013-2025)
1.6.1 Global 8K Technology Revenue (Million USD) Status and Outlook (2013-2025)
1.6.2 Global 8K Technology Sales Status and Outlook (2013-2025)
2 Global 8K Technology Market Competition by Manufacturers/Brand
2.1 8K Technology Market Competitive Situation and Trends
2.1.1 8K Technology Market Concentration Rate
2.1.2 8K Technology Market Share (%) of Top 3 and Top 5 Manufacturers
2.1.3 Mergers & Acquisitions, Expansion
3 Global 8K Technology Sales , Revenue (Million USD) by Regions (2013-2018)
3.1 Global 8K Technology Sales and Market Share (%) by Regions (2013-2018)
3.2 Global 8K Technology Revenue (Million USD) and Market Share (%) by Regions (2013-2018)
3.3 Global 8K Technology Sales , Revenue (Million USD), Price (USD/Unit) and Gross Margin (%) (2013-2018)
3.4 North America 8K Technology Sales , Revenue (Million USD), Price (USD/Unit) and Gross Margin (%) (2013-2018)
3.5 Europe 8K Technology Sales , Revenue (Million USD), Price (USD/Unit) and Gross Margin (%) (2013-2018)
3.6 Asia-Pacific 8K Technology Sales , Revenue (Million USD), Price (USD/Unit) and Gross Margin (%) (2013-2018)
3.7 South America 8K Technology Sales , Revenue (Million USD), Price (USD/Unit) and Gross Margin (2013-2018)
3.8 Middle East and Africa 8K Technology Sales , Revenue (Million USD), Price (USD/Unit) and Gross Margin (%) (2013-2018)
4 Global 8K Technology Sales, Revenue, Price Trend by Types
4.1 Global 8K Technology Sales and Market Share (%) by Types (2013-2018)
4.2 Global 8K Technology Revenue and Market Share (%) by Types (2013-2018)
4.3 Global 8K Technology Price (USD/Unit) by Type (2013-2018)
4.4 Global 8K Technology Sales Growth by Type (2013-2018)
5 Global 8K Technology Market Analysis by Applications
5.1 Global 8K Technology Sales and Market Share (%) by Applications (2013-2018)
5.2 Global 8K Technology Sales Growth Rate (%) by Applications (2013-2018)
6 Global 8K Technology Manufacturers Profiles/Analysis
6.1 BOE Japan Co. Ltd.
6.1.1 Company Basic Information, Manufacturing Base, Sales Area and Its Competitors
6.1.2 8K Technology Product Category, End Uses and Specification
6.1.2.1 Product A
6.1.2.2 Product B
6.1.3 Market Share (%) (2013-2018)
6.1.4 Main Business/Business Overview
6.2 Canon Inc.
6.2.1 Company Basic Information, Manufacturing Base, Sales Area and Its Competitors
6.2.2 8K Technology Product Category, End Uses and Specification
6.2.2.1 Product A
6.2.2.2 Product B
6.2.3 Market Share (%) (2013-2018)
6.2.4 Main Business/Business Overview
6.3 Dell Inc.
6.3.1 Company Basic Information, Manufacturing Base, Sales Area and Its Competitors
6.3.2 8K Technology Product Category, End Uses and Specification
6.3.2.1 Product A
6.3.2.2 Product B
6.3.3 Market Share (%) (2013-2018)
6.3.4 Main Business/Business Overview
6.4 Hisense Co Ltd.
6.4.1 Company Basic Information, Manufacturing Base, Sales Area and Its Competitors
6.4.2 8K Technology Product Category, End Uses and Specification
6.4.2.1 Product A
6.4.2.2 Product A
6.4.3 Market Share (%) (2013-2018)
6.4.4 Main Business/Business Overview
6.5 Ikegami Tsushinki Co. Ltd.
6.5.1 Company Basic Information, Manufacturing Base, Sales Area and Its Competitors
6.5.2 8K Technology Product Category, End Uses and Specification
6.5.2.1 Product A
6.5.2.2 Product B
6.5.3 Market Share (%) (2013-2018)
6.5.4 Main Business/Business Overview
6.6 LG Electronics Inc.
6.6.1 Company Basic Information, Manufacturing Base, Sales Area and Its Competitors
6.6.2 8K Technology Product Category, End Uses and Specification
6.6.2.1 Product A
6.6.2.2 Product B
6.6.3 Market Share (%) (2013-2018)
6.6.4 Main Business/Business Overview
6.7 Panasonic Corporation
6.7.1 Company Basic Information, Manufacturing Base, Sales Area and Its Competitors
6.7.2 8K Technology Product Category, End Uses and Specification
6.7.2.1 Product A
6.7.2.2 Product B
6.7.3 Market Share (%) (2013-2018)
6.7.4 Main Business/Business Overview
6.8 Red Digital Cinema Camera Company
6.8.1 Company Basic Information, Manufacturing Base, Sales Area and Its Competitors
6.8.2 8K Technology Product Category, End Uses and Specification
6.8.2.1 Product A
6.8.2.2 Product B
6.8.3 Market Share (%) (2013-2018)
6.8.4 Main Business/Business Overview
6.9 Samsung Group
6.9.1 Company Basic Information, Manufacturing Base, Sales Area and Its Competitors
6.9.2 8K Technology Product Category, End Uses and Specification
6.9.2.1 Product A
6.9.2.2 Product B
6.9.3 Market Share (%) (2013-2018)
6.9.4 Main Business/Business Overview
6.10 Sharp Corporation
6.10.1 Company Basic Information, Manufacturing Base, Sales Area and Its Competitors
6.10.2 8K Technology Product Category, End Uses and Specification
6.10.2.1 Product A
6.10.2.2 Product B
6.10.3 Market Share (%) (2013-2018)
6.10.4 Main Business/Business Overview
7 8K Technology Manufacturing Cost Analysis
7.1 8K Technology Key Raw Materials Analysis
7.1.1 Key Raw Materials
7.1.1 Raw Materials
7.1.2 Labor Cost
7.1.3 Manufacturing Expense
8 Marketing Strategy Analysis, Distributors/Traders
8.1 Marketing Channel
8.1.1 Direct Marketing
8.1.2 Indirect Marketing
8.1.3 Marketing Channel Development Trend
8.2 Market Positioning
8.2.1 Pricing Strategy
8.2.2 Brand Strategy
8.2.3 Target Client
8.3 Distributors/Traders List
9 Market Effect Factors Analysis
9.1 Technology Progress/Risk
9.1.1 Substitutes Threat
9.1.2 Technology Progress in Related Industry
9.2 Consumer Needs/Customer Preference Change
9.3 Economic/Political Environmental Change
10 Global 8K Technology Market Forecast (2018-2025)
10.1 Global 8K Technology Sales , Revenue (Million USD) Forecast (2018-2025)
10.1.1 Global 8K Technology Sales and Growth Rate (%) Forecast (2018-2025)
10.1.2 Global 8K Technology Revenue (Million USD) and Growth Rate (%) Forecast (2018-2025)
10.1.3 Global 8K Technology Price and Trend Forecast (2018-2025)
10.2 Global 8K Technology Sales and Revenue (Million USD) Forecast by Regions (2018-2025)
10.2.1 North America 8K Technology Sales and Revenue (Million USD) Forecast (2018-2025)
10.2.2 Europe 8K Technology Sales and Revenue (Million USD) Forecast (2018-2025)
10.2.3 Asia-Pacific 8K Technology Sales and Revenue (Million USD) Forecast (2018-2025)
10.2.4 South America 8K Technology Sales and Revenue (Million USD) Forecast (2018-2025)
10.2.5 Middle East and Africa 8K Technology Sales and Revenue (Million USD) Forecast (2018-2025)
10.3 Global 8K Technology Sales , Revenue (Million USD), Price (USD/Unit) Forecast by Type (2018-2025)
10.4 Global 8K Technology Sales Forecast by Application (2018-2025)
11 Research Findings and Conclusion
12 Methodology and Data Source
12.1 Methodology/Research Approach
12.1.1 Research Programs/Design
12.1.2 Market Size Estimation
12.1.3 Market Breakdown and Data Triangulation
12.2 Data Source
12.2.1 Secondary Sources
12.2.2 Primary Sources
12.3 Disclaimer
12.4 Author List
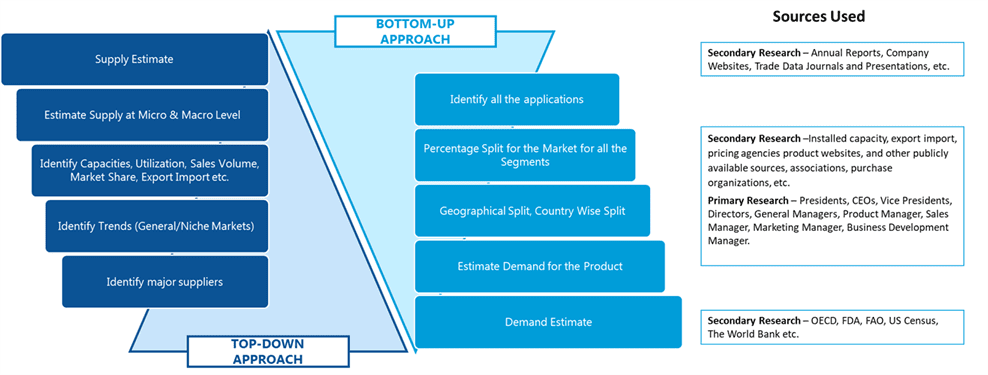
SDMR employs a three way data triangulation approach to arrive at market estimates. We use primary research, secondary research and data triangulation by top down and bottom up approach
Secondary Research:
Our research methodology involves in-depth desk research using various secondary sources. Data is gathered from association/government publications/databases, company websites, press releases, annual reports/presentations/sec filings, technical papers, journals, research papers, magazines, conferences, tradeshows, and blogs.
Key Data Points through secondary research-
Macro-economic data points
Import Export data
Identification of major market trends across various applications
Primary understanding of the industry for both the regions
Competitors analysis for the production capacities, key production sites, competitive landscape
Key customers
Production Capacity
Pricing Scenario
Cost Margin Analysis
Key Data Points through primary research-
Major factors driving the market and its end application markets
Comparative analysis and customer analysis
Regional presence
Collaborations or tie-ups
Annual Production, and sales
Profit Margins
Average Selling Price
Data Triangulation:
Data triangulation is done using top down and bottom approaches. However, to develop accurate market sizing estimations, both the methodologies are used to accurately arrive at the market size. Insert Image
