The global Pressure Sensitive Adhesive market will reach $ 13.5 billion by 2025 growing at a CAGR of 6.8% from 2018-2025. Acrylic Pressure Sensitive Adhesive is consumed in large quantities due to the variety of its applications. The consumption is set to increase in future due to the growth in end use industries. Acrylic PSA products are preferred in developing markets due to its economical price when compared with other chemistries.
Acrylic PSA is popular in A&T and E&E industries due to its ability to provide adhesion to a wide range of substrates. In 2016, Asia-Pacific region is the largest consumer of PSA tapes and labels. China is the largest consumer in the region. Acrylic PSAs is used in the manufacturing of carton sealing tape and paper labels. China alone produces more than 15 billion square meters of pressure-sensitive tape and label and graphic products. China, Taiwan and South Korea are the largest manufactures of electronics in APAC region and due to wide use acrylic based PSA; the E&E industry is a valuable application. China is the largest car manufacturer in Asia, making it a high value market for acrylic tapes and labels for automotive industry. By Technology, the Pressure Sensitive Adhesive market has been segmented on the basis of solvent based, water based, hot-melt and others. The hot melt technology is the fastest growing segment mainly due to increasing of hotmelt PSA’s demand from end-user industries such as electrical & telecommunications, electronics, packaging and footwear applications.
Various applications of pressure sensitive adhesives are automotive and transportation, electrical & electronics, packaging, aerospace, medical, building and construction, electrical & electronics, industrial assembly, aerospace and others. Packaging accounts for the largest share as it is not only used for packaging purpose but also for day to day use in many households giving it a larger market share when compared to other applications
Companies are adopting various strategies by creating competitive advantage by capturing new technologies, and leverage more and more customized products to cater various industry
segments. The major players in this market are Avery Dennison, ALFA Klebstoffe AG, Ardex GmbH, Bostik, HB Fuller, 3M, Forbo, Geistlich Ligamenta AG, Gludan Deutscheland GmbH, Keyser & Mackay, Collodin Chemie, Kleiberit, Collano, Kraton Polmers Nederlands, Cabot Corporation, Bolton Adhesives, ATO Adhesive Systems, ALFA Klebstoffe AG, CTA GmbH, EUKALIN Spezial-Kelbstoff Fabrik GmbH, Bodo Moller Chemie.
1. Introduction
2. Executive Summary
3. Pressure Sensitive Adhesives Overview
3.1. Introduction
3.2. Key characteristics
3.3. Key benefits
3.4. Production process
3.5. Property comparison
3.6. Product life cycle analysis
3.7. Environmental impact
3.8. Value chain analysis
3.9. Porter five forces analysis
4. Pressure Sensitive Adhesives by Technology
4.1. By Technology across North America, Europe, APAC & Rest of the World
4.1.1. Current scenario for 2016
4.1.1.1. Solvent based
4.1.1.2. Water based
4.1.1.3. Hot-melt
4.1.1.4. Other
4.1.2. Forecast from 2017 to 2022
4.1.2.1. Solvent based
4.1.2.2. Water based
4.1.2.3. Hot-melt
4.1.2.4. Other
5. Pressure Sensitive Adhesives by Chemistry with their applications
5.1. Acrylic PSA
5.1.1. Introduction
5.1.2. Current market for 2016 by applications across North America, Europe, Asia, RoW
5.1.2.1. Automotive and transportation
5.1.2.2. Electrical & Electronics
5.1.2.3. Packaging
5.1.2.4. Aerospace
5.1.2.5. Medical
5.1.2.6. Building and construction
5.1.2.7. Others
5.1.3. Forecast from 2017 to 2022 by applications across North America, Europe, Asia, RoW
5.1.3.1. Automotive and transportation
5.1.3.2. Electrical & Electronics
5.1.3.3. Packaging
5.1.3.4. Aerospace
5.1.3.5. Medical
5.1.3.6. Building and construction
5.1.3.7. Others
5.1.4. Key growth drivers
5.1.5. Constraints
5.2. Rubber PSA
5.2.1. Introduction
5.2.2. Current market for 2016 by applications across North America, Europe, Asia, RoW
5.2.2.1. Electrical & Electronics
5.2.2.2. Building and construction
5.2.2.3. Automotive and transportation
5.2.2.4. Medical
5.2.2.5. Packaging
5.2.2.6. Aerospace
5.2.2.7. Others
5.2.3. Forecast from 2017 to 2022 by applications across North America, Europe, Asia, RoW
5.2.3.1. Electrical & Electronics
5.2.3.2. Building and construction
5.2.3.3. Automotive and transportation
5.2.3.4. Medical
5.2.3.5. Packaging
5.2.3.6. Aerospace
5.2.3.7. Others
5.2.4. Key growth drivers
5.2.5. Constraints
5.3. Silicone PSA
5.3.1. Introduction
5.3.2. Current market for 2016 by applications across North America, Europe, Asia, RoW
5.3.2.1. Electrical & Electronics
5.3.2.2. Medical
5.3.2.3. Industrial assembly
5.3.2.4. Aerospace
5.3.2.5. Others
5.3.3. Forecast from 2017 to 2022 by applications across North America, Europe, Asia, RoW
5.3.3.1. Electrical & Electronics
5.3.3.2. Medical
5.3.3.3. Industrial assembly
5.3.3.4. Aerospace
5.3.3.5. Others
5.3.4. Key growth drivers
5.3.5. Constraints
5.4. EVA PSA
5.4.1. Introduction
5.4.2. Current market for 2016 by applications across North America, Europe, Asia, RoW
5.4.2.1. General assembly
5.4.2.2. HVAC
5.4.2.3. Packaging
5.4.2.4. Others
5.4.3. Forecast from 2017 to 2022 by applications across North America, Europe, Asia, RoW
5.4.3.1. General assembly
5.4.3.2. HVAC
5.4.3.3. Packaging
5.4.3.4. Others
5.4.4. Key growth drivers
5.4.5. Constraints
5.5. Hybrid PSA
5.5.1. Introduction
5.5.2. Current market for 2016 by applications across North America, Europe, Asia, RoW
5.5.2.1. Packaging
5.5.2.2. Aerospace
5.5.2.3. Medical
5.5.2.4. Solar
5.5.2.5. Others
5.5.3. Forecast from 2017 to 2022 by applications across North America, Europe, Asia, RoW
5.5.3.1. Packaging
5.5.3.2. Aerospace
5.5.3.3. Medical
5.5.3.4. Solar
5.5.3.5. Others
5.5.4. Key growth drivers
5.5.5. Constraints
5.6. Other PSAs
5.6.1. Introduction
5.6.2. Current market for 2016 by applications across North America, Europe, Asia, RoW
5.6.2.1. Building & Construction
5.6.2.2. Packaging
5.6.2.3. Electrical & Electronics
5.6.2.4. Automotive & Transportation
5.6.2.5. Others
5.6.3. Forecast from 2017 to 2022 by applications across North America, Europe, Asia, RoW
5.6.3.1. Building & Construction
5.6.3.2. Packaging
5.6.3.3. Electrical & Electronics
5.6.3.4. Automotive & Transportation
5.6.3.5. Others
5.6.4. Key growth drivers
5.6.5. Constraints
6. Competitive Benchmarking*
6.1. Company 1 (same parameters to be repeated for all the companies )
6.1.1. Company introduction
6.1.2. SWOT analysis in terms of Boron Nitride
6.1.3. Financials*
6.1.4. Employee and R&D details**
6.1.5. Products offerings
6.1.6. Plant locations
6.1.7. Installed capacity and utilisation rates
6.1.7.1. Capacity expansion plans
6.1.7.2. Capacity shares
6.1.7.3. Market shares
6.1.8. Strategic imperatives
6.1.9. Key Players
6.1.9.1. Americas, Europe & Asia (exc. China)
6.1.9.1.1. Henkel
6.1.9.1.2. ITW-Devcon
6.1.9.1.3. Avery Dennison
6.1.9.1.4. Bostik
6.1.9.1.5. HB Fuller
6.1.9.1.6. 3M
6.1.9.1.7. Forbo
6.1.9.1.8. Geistlich Ligamenta AG
6.1.9.1.9. Gludan Deutscheland GmbH
6.1.9.1.10. Jowat Adhesives
6.1.9.1.11. Keyser & Mackay
6.1.9.1.12. Collodin Chemie
6.1.9.1.13. Kleiberit
6.1.9.1.14. Kraton Polmers Nederlands
6.1.9.1.15. Collano
6.1.9.1.16. ALFA Klebstoffe AG
6.1.9.1.17. Ardex GmbH
6.1.9.1.18. ATO Adhesive Systems
6.1.9.1.19. Bodo Moller Chemie
6.1.9.1.20. Bolton Adhesives
6.1.9.1.21. Cabot Corporation
6.1.9.1.22. Ceroplats Technise Klebebander GmbH
6.1.9.1.23. CHT R. Beitlich GmbH
6.1.9.1.24. CTA GmbH
6.1.9.1.25. EUKALIN Spezial-Kelbstoff Fabrik GmbH
6.1.9.1.26. Alberdingk Boley
6.1.9.1.27. Sika
6.1.9.1.28. Organik Kimya Nederlands B. V.
6.1.9.1.29. Planatol Wetzell
6.1.9.1.30. PRHO-Chem GmbH & 25 others ( We have profiled 50+ players)
6.1.9.2. China
6.1.9.2.1. Beijing Donglian Chemical Co. Ltd.
6.1.9.2.2. Beijing Eastern Acrylic Chemical Technology Co. Ltd.
6.1.9.2.3. Dongtai City Huale Rubber Industry Co.Ltd
6.1.9.2.4. Dongying City Jinyoulai Industry and Trade Co.Ltd
6.1.9.2.5. Hangzhou Wanli Synthetic Organic Chemical Co.Ltd
6.1.9.2.6. Hebei Jinliji Chemical Group
6.1.9.2.7. Jiangyin City Standard Rubberizing Material Factory
6.1.9.2.8. Jilin Huafeng Organs Silicon Co. Ltd.
6.1.9.2.9. Putian City Xinbang Adhesive Product Co. ,Ltd. And Others (We have profiled 20+ players)
*as per the information availability
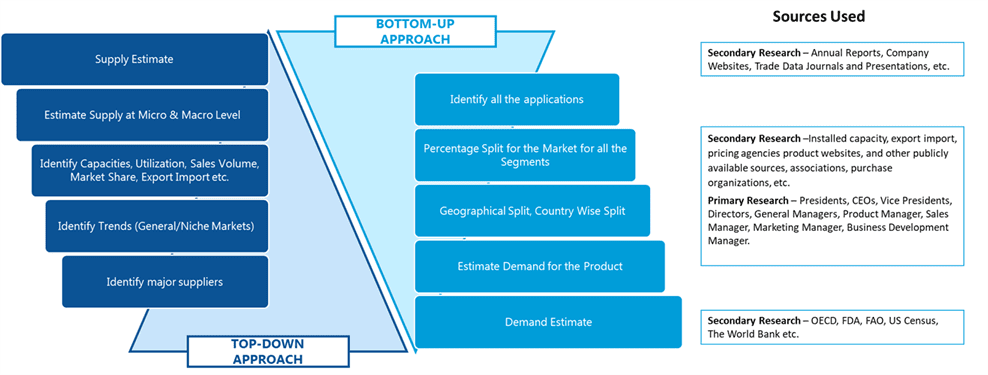
SDMR employs a three way data triangulation approach to arrive at market estimates. We use primary research, secondary research and data triangulation by top down and bottom up approach
Secondary Research:
Our research methodology involves in-depth desk research using various secondary sources. Data is gathered from association/government publications/databases, company websites, press releases, annual reports/presentations/sec filings, technical papers, journals, research papers, magazines, conferences, tradeshows, and blogs.
Key Data Points through secondary research-
Macro-economic data points
Import Export data
Identification of major market trends across various applications
Primary understanding of the industry for both the regions
Competitors analysis for the production capacities, key production sites, competitive landscape
Key customers
Production Capacity
Pricing Scenario
Cost Margin Analysis
Key Data Points through primary research-
Major factors driving the market and its end application markets
Comparative analysis and customer analysis
Regional presence
Collaborations or tie-ups
Annual Production, and sales
Profit Margins
Average Selling Price
Data Triangulation:
Data triangulation is done using top down and bottom approaches. However, to develop accurate market sizing estimations, both the methodologies are used to accurately arrive at the market size. Insert Image
