Global drone defense system market accounted for a market value of USD 1.2 billion in 2018, and is expected to reach USD 13.4 billion by 2023, growing at an estimated CAGR of 62.0% from 2018 to 2023. This shows that the global drone defense system market is growing at a rapid pace. In the U.S. alone, this is a $400 million market that is expected to reach nearly $2 billion in five years. The technology provides the means to detect and triangulate the position of UAVs, using computers and mobile devices to reflect data. Drone Defense System Market is expected to witness a promising growth in next couple of years owing to the increasing incidences of security breach by commercial drones, and along with the increasing need for the development of countermeasure systems that can safely and quickly detect anti-drones and counter them. Additionally, with the adoption of drones across various industries and product advancements in the drone technology is expected to play key role in the high growth of Drone Defense System Market.
Organizations such as the U.S. Marines and the FAA are relying on advanced drone detection and mapping technology. The drone defense market is growing robustly due to the increasing misuse of drones across the globe. It deals with new emerging fears of UAVs like, terrorism, drug trafficking and corporate surveillance. On the basis of technology used to detect and disrupt UAV, the counter UAV market is classified as electronic, laser and kinetic.
Drone defense system find applications in several industries including, defense and commercial, military and defense, homeland security, and others. Military and defense segment is expected to generate largest revenue because of use of UAV’s in smuggling, spying and border trespassing. The defense industry across the globe focuses on the development of drone systems that are capable enough to track and identify drones of enemies and counter them.
Based on technology, the identification & detection segment is expected is lead the Drone Defense System Market. Identification & detection helps in detecting and identifying drones in range by analyzing the data obtained in the detection phase. Identification & detection is mostly used for border security and surveillance purposes. The RF sensing sub segment of the identification & detection segment is estimated to grow at the highest CAGR during the forecast period.
The key players operating in the drone defense system market comprises manufacturers such as DroneShield (Australia), Dedrone, INC. (U.S.), Aaronia AG (Germany), Blighter Surveillance Systems Ltd. (U.K.), suppliers, and technology support providers, among others. These players offer wide array of advanced technology systems, products, and services with a broad range of management, engineering, technical, communications, information services, and drone defense system capabilities. Key producers of drone defense systems have headquarters in the US. These companies are increasing their manufacturing capacity in order to meet the increase demand. Based on the recent surge in orders, for instance, the Finnish- and U.S.-based company has doubled its manufacturing capacity to keep pace with demand for its pioneering drone defense technology.
Table of Contents
1 Drone Defense System Market Overview
1.1 Drone Defense System Product Overview
1.2 Drone Defense System Segment by Technology
1.2.1 Global Drone Defense System Sales and Growth (%) Comparison by Types (2013-2025)
1.2.2 Global Drone Defense System Sales Market Share (%) by Types in 2017
1.2.3 Electronic Based Drone Defense System
1.2.4 Laser Based Drone Defense System
1.2.5 Kinetic Drone Defense System
1.3 Global Drone Defense System Segment by Applications
1.3.1 Global Drone Defense System Sales Comparison by Applications (2013-2025)
1.3.2 Defense and Commercial
1.3.3 Military and Defense
1.3.3 Homeland Security
1.3.3 Others
1.4 Global Drone Defense System Market by Regions (2013-2025)
1.4.1 Global Drone Defense System Market Size and Growth (%) Comparison by Regions (2013-2025)
1.4.2 North America Drone Defense System Status and Prospect (2013-2025)
1.4.3 Asia-Pacific Drone Defense System Status and Prospect (2013-2025)
1.4.4 Europe Drone Defense System Status and Prospect (2013-2025)
1.4.5 South America Drone Defense System Status and Prospect (2013-2025)
1.4.6 Middle East and Africa Drone Defense System Status and Prospect (2013-2025)
1.5 Global Drone Defense System Market Size (2013-2025)
1.5.1 Global Drone Defense System Revenue (Million USD) Status and Outlook (2013-2025)
1.5.2 Global Drone Defense System Sales Status and Outlook (2013-2025)
2 Global Drone Defense System Market Competition by Manufacturers/Brand
2.1 Drone Defense System Market Competitive Situation and Trends
2.1.1 Drone Defense System Market Concentration Rate
2.1.2 Drone Defense System Market Share (%) of Top 3 and Top 5 Manufacturers
2.1.3 Mergers & Acquisitions, Expansion
3 Global Drone Defense System Sales , Revenue (Million USD) by Regions (2013-2018)
3.1 Global Drone Defense System Sales and Market Share (%) by Regions (2013-2018)
3.2 Global Drone Defense System Revenue (Million USD) and Market Share (%) by Regions (2013-2018)
3.3 Global Drone Defense System Sales , Revenue (Million USD), Price (USD/Unit) and Gross Margin (%) (2013-2018)
3.4 North America Drone Defense System Sales , Revenue (Million USD), Price (USD/Unit) and Gross Margin (%) (2013-2018)
3.5 Europe Drone Defense System Sales , Revenue (Million USD), Price (USD/Unit) and Gross Margin (%) (2013-2018)
3.6 Asia-Pacific Drone Defense System Sales , Revenue (Million USD), Price (USD/Unit) and Gross Margin (%) (2013-2018)
3.7 South America Drone Defense System Sales , Revenue (Million USD), Price (USD/Unit) and Gross Margin (2013-2018)
3.8 Middle East and Africa Drone Defense System Sales , Revenue (Million USD), Price (USD/Unit) and Gross Margin (%) (2013-2018)
4 Global Drone Defense System Sales, Revenue, Price Trend by Types
4.1 Global Drone Defense System Sales and Market Share (%) by Types (2013-2018)
4.2 Global Drone Defense System Revenue and Market Share (%) by Types (2013-2018)
4.3 Global Drone Defense System Price (USD/Unit) by Type (2013-2018)
4.4 Global Drone Defense System Sales Growth by Type (2013-2018)
5 Global Drone Defense System Market Analysis by Applications
5.1 Global Drone Defense System Sales and Market Share (%) by Applications (2013-2018)
5.2 Global Drone Defense System Sales Growth Rate (%) by Applications (2013-2018)
6 Global Drone Defense System Manufacturers Profiles/Analysis
6.1 DroneShield
6.1.1 Company Basic Information, Manufacturing Base, Sales Area and Its Competitors
6.1.2 Drone Defense System Product Category, End Uses and Specification
6.1.2.1 Product A
6.1.2.2 Product B
6.1.3 Market Share (%) (2013-2018)
6.1.4 Main Business/Business Overview
6.2 Dedrone Inc.
6.2.1 Company Basic Information, Manufacturing Base, Sales Area and Its Competitors
6.2.2 Drone Defense System Product Category, End Uses and Specification
6.2.2.1 Product A
6.2.2.2 Product B
6.2.3 Market Share (%) (2013-2018)
6.2.4 Main Business/Business Overview
6.3 Thales Group
6.3.1 Company Basic Information, Manufacturing Base, Sales Area and Its Competitors
6.3.2 Drone Defense System Product Category, End Uses and Specification
6.3.2.1 Product A
6.3.2.2 Product B
6.3.3 Market Share (%) (2013-2018)
6.3.4 Main Business/Business Overview
6.4 Kelvin Hughes Limited
6.4.1 Company Basic Information, Manufacturing Base, Sales Area and Its Competitors
6.4.2 Drone Defense System Product Category, End Uses and Specification
6.4.2.1 Product A
6.4.2.2 Product A
6.4.3 Market Share (%) (2013-2018)
6.4.4 Main Business/Business Overview
6.5 Orelia SAS
6.5.1 Company Basic Information, Manufacturing Base, Sales Area and Its Competitors
6.5.2 Drone Defense System Product Category, End Uses and Specification
6.5.2.1 Product A
6.5.2.2 Product B
6.5.3 Market Share (%) (2013-2018)
6.5.4 Main Business/Business Overview
6.6 Advanced Protection Systems Sp. Z.O.O
6.6.1 Company Basic Information, Manufacturing Base, Sales Area and Its Competitors
6.6.2 Drone Defense System Product Category, End Uses and Specification
6.6.2.1 Product A
6.6.2.2 Product B
6.6.3 Market Share (%) (2013-2018)
6.6.4 Main Business/Business Overview
6.7 Blighter Surveillance Systems Ltd.
6.7.1 Company Basic Information, Manufacturing Base, Sales Area and Its Competitors
6.7.2 Drone Defense System Product Category, End Uses and Specification
6.7.2.1 Product A
6.7.2.2 Product B
6.7.3 Market Share (%) (2013-2018)
6.7.4 Main Business/Business Overview
6.8 SRC Inc
6.8.1 Company Basic Information, Manufacturing Base, Sales Area and Its Competitors
6.8.2 Drone Defense System Product Category, End Uses and Specification
6.8.2.1 Product A
6.8.2.2 Product B
6.8.3 Market Share (%) (2013-2018)
6.8.4 Main Business/Business Overview
6.9 Airbus S.A.S
6.9.1 Company Basic Information, Manufacturing Base, Sales Area and Its Competitors
6.9.2 Drone Defense System Product Category, End Uses and Specification
6.9.2.1 Product A
6.9.2.2 Product B
6.9.3 Market Share (%) (2013-2018)
6.9.4 Main Business/Business Overview
6.10 Israel Aerospace Industries
6.10.1 Company Basic Information, Manufacturing Base, Sales Area and Its Competitors
6.10.2 Drone Defense System Product Category, End Uses and Specification
6.10.2.1 Product A
6.10.2.2 Product B
6.10.3 Market Share (%) (2013-2018)
6.10.4 Main Business/Business Overview
7 Drone Defense System Manufacturing Cost Analysis
7.1 Drone Defense System Key Component Analysis
7.1.1 Key Components
7.1.1 Components
7.1.2 Labor Cost
7.1.3 Manufacturing Expense
8 Marketing Strategy Analysis, Distributors/Traders
8.1 Marketing Channel
8.1.1 Direct Marketing
8.1.2 Indirect Marketing
8.1.3 Marketing Channel Development Trend
8.2 Market Positioning
8.2.1 Pricing Strategy
8.2.2 Brand Strategy
8.2.3 Target Client
8.3 Distributors/Traders List
9 Market Effect Factors Analysis
9.1 Technology Progress/Risk
9.1.1 Substitutes Threat
9.1.2 Technology Progress in Related Industry
9.2 Consumer Needs/Customer Preference Change
9.3 Economic/Political Environmental Change
10 Global Drone Defense System Market Forecast (2018-2025)
10.1 Global Drone Defense System Sales , Revenue (Million USD) Forecast (2018-2025)
10.1.1 Global Drone Defense System Sales and Growth Rate (%) Forecast (2018-2025)
10.1.2 Global Drone Defense System Revenue (Million USD) and Growth Rate (%) Forecast (2018-2025)
10.1.3 Global Drone Defense System Price and Trend Forecast (2018-2025)
10.2 Global Drone Defense System Sales and Revenue (Million USD) Forecast by Regions (2018-2025)
10.2.1 North America Drone Defense System Sales and Revenue (Million USD) Forecast (2018-2025)
10.2.2 Europe Drone Defense System Sales and Revenue (Million USD) Forecast (2018-2025)
10.2.3 Asia-Pacific Drone Defense System Sales and Revenue (Million USD) Forecast (2018-2025)
10.2.4 South America Drone Defense System Sales and Revenue (Million USD) Forecast (2018-2025)
10.2.5 Middle East and Africa Drone Defense System Sales and Revenue (Million USD) Forecast (2018-2025)
10.3 Global Drone Defense System Sales , Revenue (Million USD), Price (USD/Unit) Forecast by Type (2018-2025)
10.4 Global Drone Defense System Sales Forecast by Application (2018-2025)
11 Research Findings and Conclusion
12 Methodology and Data Source
12.1 Methodology/Research Approach
12.1.1 Research Programs/Design
12.1.2 Market Size Estimation
12.1.3 Market Breakdown and Data Triangulation
12.2 Data Source
12.2.1 Secondary Sources
12.2.2 Primary Sources
12.3 Disclaimer
12.4 Author List
SDMR employs a three way data triangulation approach to arrive at market estimates. We use primary research, secondary research and data triangulation by top down and bottom up approach
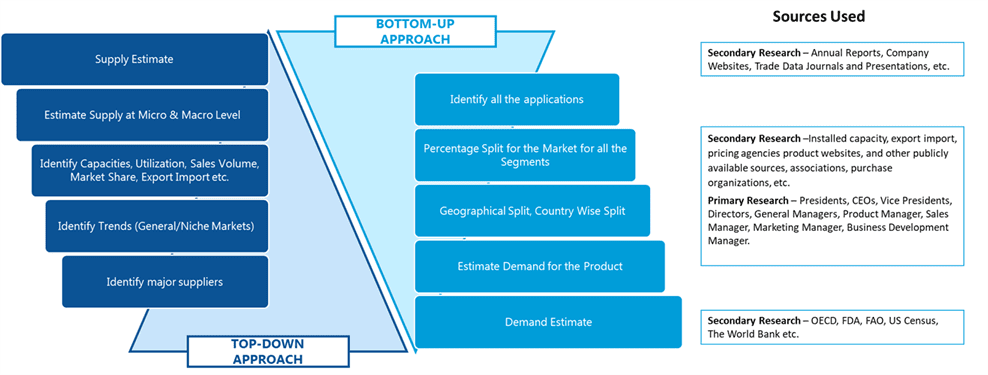
Secondary Research:
Our research methodology involves in-depth desk research using various secondary sources. Data is gathered from association/government publications/databases, company websites, press releases, annual reports/presentations/sec filings, technical papers, journals, research papers, magazines, conferences, tradeshows, and blogs.
Key Data Points through secondary research-
Macro-economic data points
Import Export data
Identification of major market trends across various applications
Primary understanding of the industry for both the regions
Competitors analysis for the production capacities, key production sites, competitive landscape
Key customers
Production Capacity
Pricing Scenario
Cost Margin Analysis
Key Data Points through primary research-
Major factors driving the market and its end application markets
Comparative analysis and customer analysis
Regional presence
Collaborations or tie-ups
Annual Production, and sales
Profit Margins
Average Selling Price
Data Triangulation:
Data triangulation is done using top down and bottom approaches. However, to develop accurate market sizing estimations, both the methodologies are used to accurately arrive at the market size. Insert Image
