The global soft cheese market is estimated to be around $ 41.0 billion in 2018 and will grow at a CAGR of 4.2% and reach around $ 50.7 billion by 2023. The major factors supporting the growth of soft cheese market includes the rise in food service outlets coupled with the change in taste and preferences of consumers. Soft cheese, being largely consumed in a number of fast foods such as pizzas, burgers, garlic breads, and sandwiches, is expected to gain high demand in near future. It is added as a taste enhancer in a number of cuisines across the world.
U.S., being one of the largest producers of soft cheese, accounts for 30% of overall world production, followed by Germany and France. France is the biggest exporter of soft cheese, based on the monetary value, followed by Germany. Among the top ten exporters, only Ireland, New Zealand, Denmark, the Netherlands, and Australia are the export oriented countries accounting for approx. 95%, 90%, 77%, 72% and 65% of their total cheese production being exported. It is expected that the soft cheese production will increase significantly in the emerging economies during the forecast period owing to the increase in the consumption rates.
The growth of soft cheese market can be attributed to the innovation and product development in the dairy industry with respect to several new types of cheeses designed for specific population segments comprising children, teenagers, affluent consumers and main stream households and for new uses of cheese in cooking, food service and food industry.
The soft cheese market has been classified on the basis of types such as skim milk soft cheese, medium fat soft cheese, and full fat soft cheese. Key application segments of soft cheese include bakery & confectionery, sweet & savory snacks, ready meals, and others. The bakery & confectionery segment captured the largest share in 2017.
In terms of consumption, Asia-Pacific will capture the largest share in 2017 followed by Europe and North America. Asia-Pacific will continue to dominate the market mainly due to high consumption potential, increasing standard of living, increasing production capacities, and high economic growth rate.
The key players operating in the soft cheese market comprises Arla Foods, Bongrain, Devondale Murray Goulburn, Fonterra, Leprino Foods, Friesland Campina, Groupe Lactalis, Almarai, Calabro Cheese Corporation, and Bega Cheese. The soft cheese market is dominated by intense competition due to the presence of a large number of organized and unorganized players.
Soft cheese market is highly unorganized in nature considering the presence of small and medium manufacturers. New product launches and expansions are the key strategies adopted by market players to expand their business and increase their customer base. Arla Foods, one of the leading player in soft cheese market, introduced a line of cream cheeses in five varieties, including herbs and spices, light, peppercorn and blueberry to expand their product portfolio and meet increased consumer demand.
Table of Contents
1 Soft Cheese Market Overview
1.1 Soft Cheese Product Overview
1.2 Soft Cheese Segment by Types (Product Category)
1.2.1 Global Soft Cheese Sales and Growth (%) Comparison by Types (2013-2025)
1.2.2 Global Soft Cheese Sales Market Share (%) by Types in 2017
1.2.3 Skim Milk Soft Cheese
1.2.4 Medium Fat Soft Cheese
1.2.5 Full Fat Soft Cheese
1.3 Global Soft Cheese Segment by Applications
1.3.1 Global Soft Cheese Sales (MT) Comparison by Applications (2013-2025)
1.3.2 Bakery & Confectionery
1.3.3 Sweet & Savory Snacks
1.3.4 Ready Meals
1.3.5 Other
1.4 Global Soft Cheese Market by Regions (2013-2025)
1.4.1 Global Soft Cheese Market Size and Growth (%) Comparison by Regions (2013-2025)
1.4.2 North America Soft Cheese Status and Prospect (2013-2025)
1.4.3 Asia-Pacific Soft Cheese Status and Prospect (2013-2025)
1.4.4 Europe Soft Cheese Status and Prospect (2013-2025)
1.4.5 South America Soft Cheese Status and Prospect (2013-2025)
1.4.6 Middle East and Africa Soft Cheese Status and Prospect (2013-2025)
1.5 Global Soft Cheese Market Size (2013-2025)
1.5.1 Global Soft Cheese Revenue (Million USD) Status and Outlook (2013-2025)
1.5.2 Global Soft Cheese Sales (MT) Status and Outlook (2013-2025)
2 Global Soft Cheese Market Competition by Manufacturers/Brand
2.1 Soft Cheese Market Competitive Situation and Trends
2.1.1 Soft Cheese Market Concentration Rate
2.1.2 Soft Cheese Market Share (%) of Top 3 and Top 5 Manufacturers
2.1.3 Mergers & Acquisitions, Expansion
3 Global Soft Cheese Sales (MT), Revenue (Million USD) by Regions (2013-2018)
3.1 Global Soft Cheese Sales (MT) and Market Share (%) by Regions (2013-2018)
3.2 Global Soft Cheese Revenue (Million USD) and Market Share (%) by Regions (2013-2018)
3.3 Global Soft Cheese Sales (MT), Revenue (Million USD), Price (USD/Unit) and Gross Margin (%) (2013-2018)
3.4 North America Soft Cheese Sales (MT), Revenue (Million USD), Price (USD/Unit) and Gross Margin (%) (2013-2018)
3.5 Europe Soft Cheese Sales (MT), Revenue (Million USD), Price (USD/Unit) and Gross Margin (%) (2013-2018)
3.6 Asia-Pacific Soft Cheese Sales (MT), Revenue (Million USD), Price (USD/Unit) and Gross Margin (%) (2013-2018)
3.7 South America Soft Cheese Sales (MT), Revenue (Million USD), Price (USD/Unit) and Gross Margin (2013-2018)
3.8 Middle East and Africa Soft Cheese Sales (MT), Revenue (Million USD), Price (USD/Unit) and Gross Margin (%) (2013-2018)
4 Global Soft Cheese Sales, Revenue, Price Trend by Types
4.1 Global Soft Cheese Sales (MT) and Market Share (%) by Types (2013-2018)
4.2 Global Soft Cheese Revenue and Market Share (%) by Types (2013-2018)
4.3 Global Soft Cheese Price (USD/Unit) by Type (2013-2018)
4.4 Global Soft Cheese Sales Growth by Type (2013-2018)
5 Global Soft Cheese Market Analysis by Applications
5.1 Global Soft Cheese Sales (MT) and Market Share (%) by Applications (2013-2018)
5.2 Global Soft Cheese Sales Growth Rate (%) by Applications (2013-2018)
6 Global Soft Cheese Manufacturers Profiles/Analysis
6.1 Arla Foods
6.1.1 Company Basic Information, Manufacturing Base, Sales Area and Its Competitors
6.1.2 Soft Cheese Product Category, End Uses and Specification
6.1.2.1 Product A
6.1.2.2 Product B
6.1.3 Market Share (%) (2013-2018)
6.1.4 Main Business/Business Overview
6.2 Bongrain
6.2.1 Company Basic Information, Manufacturing Base, Sales Area and Its Competitors
6.2.2 Soft Cheese Product Category, End Uses and Specification
6.2.2.1 Product A
6.2.2.2 Product B
6.2.3 Market Share (%) (2013-2018)
6.2.4 Main Business/Business Overview
6.3 Devondale Murray Goulburn
6.3.1 Company Basic Information, Manufacturing Base, Sales Area and Its Competitors
6.3.2 Soft Cheese Product Category, End Uses and Specification
6.3.2.1 Product A
6.3.2.2 Product B
6.3.3 Market Share (%) (2013-2018)
6.3.4 Main Business/Business Overview
6.4 Fonterra
6.4.1 Company Basic Information, Manufacturing Base, Sales Area and Its Competitors
6.4.2 Soft Cheese Product Category, End Uses and Specification
6.4.2.1 Product A
6.4.2.2 Product A
6.4.3 Market Share (%) (2013-2018)
6.4.4 Main Business/Business Overview
6.5 Leprino Foods
6.5.1 Company Basic Information, Manufacturing Base, Sales Area and Its Competitors
6.5.2 Soft Cheese Product Category, End Uses and Specification
6.5.2.1 Product A
6.5.2.2 Product B
6.5.3 Market Share (%) (2013-2018)
6.5.4 Main Business/Business Overview
6.6 Friesland Campina
6.6.1 Company Basic Information, Manufacturing Base, Sales Area and Its Competitors
6.6.2 Soft Cheese Product Category, End Uses and Specification
6.6.2.1 Product A
6.6.2.2 Product B
6.6.3 Market Share (%) (2013-2018)
6.6.4 Main Business/Business Overview
6.7 Groupe Lactalis
6.7.1 Company Basic Information, Manufacturing Base, Sales Area and Its Competitors
6.7.2 Soft Cheese Product Category, End Uses and Specification
6.7.2.1 Product A
6.7.2.2 Product B
6.7.3 Market Share (%) (2013-2018)
6.7.4 Main Business/Business Overview
6.8 Almarai
6.8.1 Company Basic Information, Manufacturing Base, Sales Area and Its Competitors
6.8.2 Soft Cheese Product Category, End Uses and Specification
6.8.2.1 Product A
6.8.2.2 Product B
6.8.3 Market Share (%) (2013-2018)
6.8.4 Main Business/Business Overview
6.9 Calabro Cheese Corporation
6.9.1 Company Basic Information, Manufacturing Base, Sales Area and Its Competitors
6.9.2 Soft Cheese Product Category, End Uses and Specification
6.9.2.1 Product A
6.9.2.2 Product B
6.9.3 Market Share (%) (2013-2018)
6.9.4 Main Business/Business Overview
6.10 Bega Cheese
6.10.1 Company Basic Information, Manufacturing Base, Sales Area and Its Competitors
6.10.2 Soft Cheese Product Category, End Uses and Specification
6.10.2.1 Product A
6.10.2.2 Product B
6.10.3 Market Share (%) (2013-2018)
6.10.4 Main Business/Business Overview
7 Soft Cheese Manufacturing Cost Analysis
7.1 Soft Cheese Key Raw Materials Analysis
7.1.1 Key Raw Materials
7.1.1 Raw Materials
7.1.2 Labor Cost
7.1.3 Manufacturing Expense
8 Marketing Strategy Analysis, Distributors/Traders
8.1 Marketing Channel
8.1.1 Direct Marketing
8.1.2 Indirect Marketing
8.1.3 Marketing Channel Development Trend
8.2 Market Positioning
8.2.1 Pricing Strategy
8.2.2 Brand Strategy
8.2.3 Target Client
8.3 Distributors/Traders List
9 Market Effect Factors Analysis
9.1 Technology Progress/Risk
9.1.1 Substitutes Threat
9.1.2 Technology Progress in Related Industry
9.2 Consumer Needs/Customer Preference Change
9.3 Economic/Political Environmental Change
10 Global Soft Cheese Market Forecast (2018-2025)
10.1 Global Soft Cheese Sales (MT), Revenue (Million USD) Forecast (2018-2025)
10.1.1 Global Soft Cheese Sales (MT) and Growth Rate (%) Forecast (2018-2025)
10.1.2 Global Soft Cheese Revenue (Million USD) and Growth Rate (%) Forecast (2018-2025)
10.1.3 Global Soft Cheese Price and Trend Forecast (2018-2025)
10.2 Global Soft Cheese Sales (MT) and Revenue (Million USD) Forecast by Regions (2018-2025)
10.2.1 North America Soft Cheese Sales (MT) and Revenue (Million USD) Forecast (2018-2025)
10.2.2 Europe Soft Cheese Sales (MT) and Revenue (Million USD) Forecast (2018-2025)
10.2.3 Asia-Pacific Soft Cheese Sales (MT) and Revenue (Million USD) Forecast (2018-2025)
10.2.4 South America Soft Cheese Sales (MT) and Revenue (Million USD) Forecast (2018-2025)
10.2.5 Middle East and Africa Soft Cheese Sales (MT) and Revenue (Million USD) Forecast (2018-2025)
10.3 Global Soft Cheese Sales (MT), Revenue (Million USD), Price (USD/Unit) Forecast by Type (2018-2025)
10.4 Global Soft Cheese Sales (MT) Forecast by Application (2018-2025)
11 Research Findings and Conclusion
12 Methodology and Data Source
12.1 Methodology/Research Approach
12.1.1 Research Programs/Design
12.1.2 Market Size Estimation
12.1.3 Market Breakdown and Data Triangulation
12.2 Data Source
12.2.1 Secondary Sources
12.2.2 Primary Sources
12.3 Disclaimer
12.4 Author List
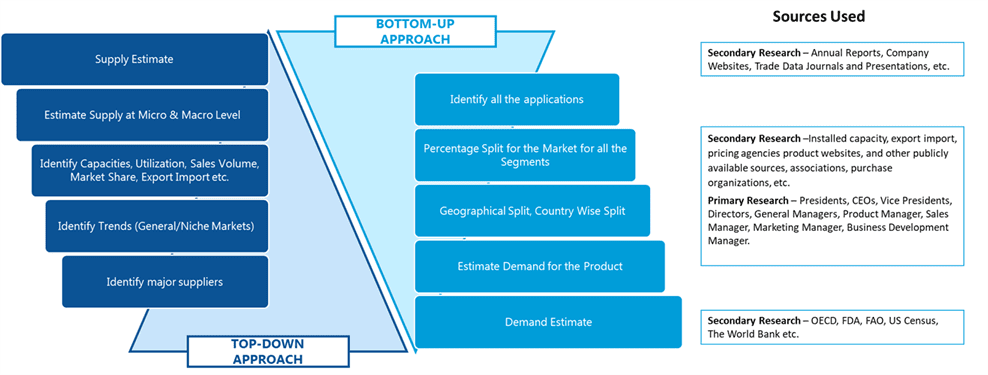
SDMR employs a three way data triangulation approach to arrive at market estimates. We use primary research, secondary research and data triangulation by top down and bottom up approach
Secondary Research:
Our research methodology involves in-depth desk research using various secondary sources. Data is gathered from association/government publications/databases, company websites, press releases, annual reports/presentations/sec filings, technical papers, journals, research papers, magazines, conferences, tradeshows, and blogs.
Key Data Points through secondary research-
Macro-economic data points
Import Export data
Identification of major market trends across various applications
Primary understanding of the industry for both the regions
Competitors analysis for the production capacities, key production sites, competitive landscape
Key customers
Production Capacity
Pricing Scenario
Cost Margin Analysis
Key Data Points through primary research-
Major factors driving the market and its end application markets
Comparative analysis and customer analysis
Regional presence
Collaborations or tie-ups
Annual Production, and sales
Profit Margins
Average Selling Price
Data Triangulation:
Data triangulation is done using top down and bottom approaches. However, to develop accurate market sizing estimations, both the methodologies are used to accurately arrive at the market size. Insert Image
