The total 3D Printing is likely to reach $ 35.0 billion by the end of 2023, growing at a CAGR of 25% from 2017-2023. The factors contributing towards the growth of 3D printing are easy manufacturing and heavy cost reductions, reduction of errors, optimum utilization of the raw materials, production of customized products, rising innovative raw materials for production and efficient use of production time and financials. A huge demand has been observed for precision machined components in a large range of end use industries. Currently, the 3D Printing market is expected to witness high growth as there is latent demand for easy creation of the complex design and geometries in certain industries as medical and dental. Also, the market is experiencing the increased competitive pressure for the investment in R&D as well as strong hunger for innovative printing materials and manufacturing techniques.
In 2017, the 3D Printing market is dominated by North America followed by Europe and then Asia-Pacific. This growth in 3D Printing market is likely to occur due to growing applications of additive manufacturing in automobile, medical and consumer industry. The 3D printing technology in Defense industry particularly in USA will experience robust CAGR of 24% in the next five years mainly due to as 3D printing helps in reducing weight, leading to improved strength. The technology can produce highly complex parts as single-component systems. Easy printing spare parts and replacements 3D printing technology is natural fit for many defense applications.
The Plastic segment accounted for the largest market share in 2017 and the category of other materials such as wax, paper, laywood, etc. are anticipated to witness the highest growth compelled by the increasing use of these materials in healthcare and medical industries.
The various end-user industries of 3D Printing market are healthcare and medical, aerospace, automotive, defense and military, energy, education and others. The growing end use verticals such as wearable electronics, education and food and bakery will experience the highest CAGR from 2018-2023 whereas automotive, defense and healthcare and medical would be the largest market share owners during the forecast period. 3D bioprinting is developing very furiously as it is highly supported by the applications in In-Vitro Testing to discover new drugs as well as prototype printing of the organs and body parts.
Huge investment has been done by the companies in 3D Printing Technology for example in 2016, GE has invested about $1.4 billion on buying two European 3D Printing companies Arcam AB from Sweden and SLM Solutions Group from Germany. This acquisition is expected to cut costs by US$3 billion to US$5 billion across the company, as the 3D technology could heavily reduce design and material costs and it is expected that company would purchase approximately 1,000 new 3D printing machines by the next decade. The major players in the 3D Printing market are 3D Systems, HP, Autodesk, Inc., Hoganas AB, Stratasys Ltd, Optomec, Inc., Arcam Group, The ExOne Company, Beijing Tiertime Technology, Nano Dimensions, Renishaw PLC, Voxeljet AG, Envisiontec GmbH, EOS GmbH, ARC Group Worldwide and other
1 Introduction
1.1 Goal & Objective
1.2 Report Coverage
1.3 Supply Side Data Modelling & Methodology
1.4 Demand Side Data Modelling & Methodology
2 Executive Summary
3 Market Outlook
3.1 Introduction
3.2 Current & Future Outlook
3.3 DROC
3.3.1 Drivers
3.3.1.1 Demand Drivers
3.3.1.2 Supply Drivers
3.3.2 Restraints
3.3.3 Opportunities
3.3.4 Challenges
3.4 Market Entry Matrix
3.5 Market Opportunity Analysis
3.6 Market Regulations
3.7 Pricing Mix
3.8 Key Customers
3.9 Value Chain & Ecosystem
4 Market Demand Analysis
4.1 3D Printing Market, By Material
4.1.1 Plastics
4.1.1.1 Photopolymers
4.1.1.2 Thermoplastics
4.1.1.3.1 Nylon
4.1.1.3.2 Polyatic Acid (PLA)
4.1.1.3.3 Acrylonitrile Butadiene Styrene (ABS)
4.1.1.3.4 Others
4.1.2 Ceramics and Glass
4.1.2.1 Glass
4.1.2.2 Silica
4.1.2.3 Others
4.1.3 Metals and Alloys
4.1.3.1 Gold
4.1.3.2 Silver
4.1.3.3 Titanium
4.1.3.4 Steel
4.1.3.5 Aluminum
4.1.3.6 Others
4.1.4 Other Printing Materials
4.1.4.1 Wax
4.1.4.2 Wood
4.1.4.3 Paper
5 3D Printing Market Analysis, By End-User
5.1 Introduction
5.2 Healthcare and Medical
5.3 Automotive
5.4 Consumer Electronics Products
5.5 Aerospace
5.6 Defense and Military
5.7 Building, Construction and Architecture
5.8 Energy
5.9 Education
5.10 Manufacturing
5.11 Others
6 3D Printing Market Analysis, By Technology
6.1 Stereolithography (SLA)
6.2 Selective Laser Sintering (SLS)
6.3 PolyJet
6.4 Fused Deposition Modelling (FDM)
6.5 Others
7 3D Printing Market Analysis, By Application
7.1 Tooling
7.2 Prototyping
7.3 Functional Part Manufacturing
9 3D Printing Market Analysis, By Region
9.1 North America
9.1.1 US
9.1.2 Canada
9.1.3 Mexico
9.2 Europe
9.2.1 Germany
9.2.2 Italy
9.2.3 France
9.2.4 UK
9.2.5 Rest of Europe
9.3 Asia Pacific
9.3.1 China
9.3.2 Japan
9.3.3 India
9.3.4 Australia
9.3.5 Singapore
9.3.6 Rest of APAC
9.4 Middle East & Africa
9.4.1 Saudi Arabia
9.4.2 UAE
9.4.3 Rest Of MEA
9.5 South America
9.5.1 Brazil
9.5.2 Argentina
9.5.3 Rest of South America
10 Supply Market Analysis (Industry Player Analysis)
10.1 Strategic Benchmarking
10.2 Market Share Analysis
10.3 Key Players
10.3.1 3D Systems
10.3.2 Autodesk, Inc.
10.3.3 Hoganas AB
10.3.4 Stratasys Ltd
10.3.5 Optomec, Inc.
10.3.6 Arcam Group
10.3.7 The ExOne Company
10.3.8 Beijing Tiertime Technology
10.3.9 Nano Dimensions
10.3.10 Renishaw PLC
10.3.11 Voxeljet AG
10.3.12 Envisiontec GmbH
10.3.13 EOS GmbH
10.3.14 ARC Group Worldwide, Inc & Others
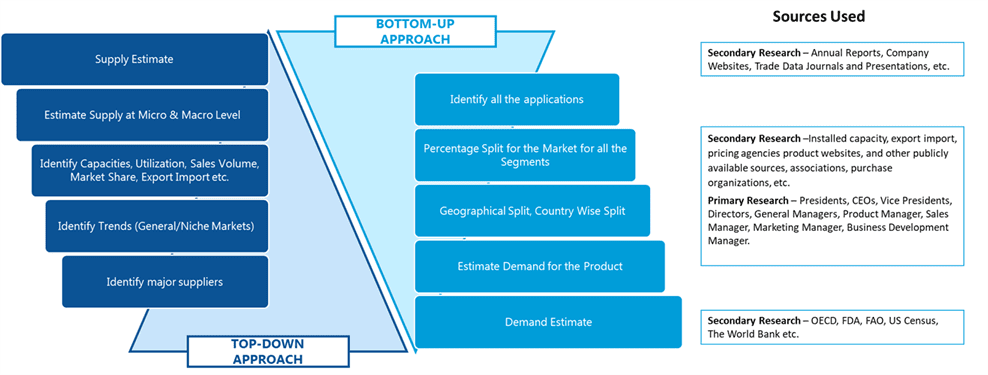
SDMR employs a three way data triangulation approach to arrive at market estimates. We use primary research, secondary research and data triangulation by top down and bottom up approach
Secondary Research:
Our research methodology involves in-depth desk research using various secondary sources. Data is gathered from association/government publications/databases, company websites, press releases, annual reports/presentations/sec filings, technical papers, journals, research papers, magazines, conferences, tradeshows, and blogs.
Key Data Points through secondary research-
Macro-economic data points
Import Export data
Identification of major market trends across various applications
Primary understanding of the industry for both the regions
Competitors analysis for the production capacities, key production sites, competitive landscape
Key customers
Production Capacity
Pricing Scenario
Cost Margin Analysis
Key Data Points through primary research-
Major factors driving the market and its end application markets
Comparative analysis and customer analysis
Regional presence
Collaborations or tie-ups
Annual Production, and sales
Profit Margins
Average Selling Price
Data Triangulation:
Data triangulation is done using top down and bottom approaches. However, to develop accurate market sizing estimations, both the methodologies are used to accurately arrive at the market size. Insert Image
