This report provides the in-depth analysis of the complete value chain of the pressure sensitive adhesives market from the raw material suppliers to the end users. We have critically analysed following parameters and their impact in the industry:
1. Improvement in top line and bottom line growth
Analysis trend & forecasts by end use markets will help you to understand how the growth in consumption is expected in next 5 years and what will be the key factors that will support the growth. This will help to make a clear plan for the top line growth. Price analytics will also play a crucial role in making a plan for top line growth.
Raw material and other input factors analysis will help to plan effectively for the bottom line.
2. Competitive intelligence
In a competitive marketplace, up-to-date information can make the difference between keeping pace, getting ahead, or being left behind. A smart intelligence operation can serve as an early-warning system for disruptive changes in the competitive landscape, whether that change is a rival's new product or pricing strategy or the entrance of an unexpected player into your market.
We also provide you with information that allows you to anticipate what your competitors are planning next. For example, you might gain information on a new product they are getting ready to launch or new services they will add to the business. Hiring us to handle this information collection saves you time and energy, allowing you to focus on your own business while still gaining the necessary knowledge to keep track of competitors.
3. Identification of prospective customers and their satisfaction level with the current supplier:
We have provided the long list of customers and analysed them critically, based on various parameters such as consumption, market type, sustainable business etc. this will help your organisation to develop relations with these consumers of cellulose ethers. Also we have identified the factors in which the others customer will switch to you.
4. Voice of customer analysis
To increase conversion, in order to better understand existing / prospective customers’ purchase behaviours / decisions. Boost sales by making product improvements customers really want.
Gain a competitive advantage by having real time access to changes in customer behaviours and needs.
Methodology and sources
We use the following steps to complete the report:
Desk research
Market size, capacity and production information
The sources of desk research are various, including published magazines, journals, government statistics, industrial statistics, customs statistics, association seminars as well as information from the Internet.
A lot of work goes into compilation and analysis of the obtained information.
Analysis of import & export data
Preliminary analysis of import & export situation of PSAs in order to:
Evaluate the import & export situation
Evaluate the role of overseas products in domestic market
Primary research
We carry out extensive telephone interviews across the value chain in order to survey the actual market situation. The interviewees will cover:
Major producers
Major customers
Key traders
Raw materials suppliers
Industry associations
Bottom-up research
According to telephone interviews, matrix excel is designed to deal with complicated and abundant data that are mainly about capacity, output and consumption. Based on the consumption data in the past from 2011 to 2016, future demand data from 2017 to 2022 is forecasted with the method of bottom-up research.
Report generation
Logical analysis and scientific ratiocination will be conducted to generate the report. All the data and findings obtained in the above stages are presented in the report clearly.
1. Executive summary
2. Pressure Sensitive Adhesives Overview
2.1. Introduction
2.2. Key characteristics
2.3. Key benefits
2.4. Production process
2.5. Property comparison
2.6. Product life cycle analysis
2.7. Environmental impact
2.8. Value chain analysis
2.9. Porter five forces analysis
3. Pressure Sensitive Adhesives by Technology
3.1. By Technology across North America, Europe, APAC & Rest of the World
3.1.1. Current scenario for 2016
3.1.1.1. Solvent based
3.1.1.2. Water based
3.1.1.3. Hot-melt
3.1.1.4. Other
3.1.2. Forecast from 2017 to 2022
3.1.2.1. Solvent based
3.1.2.2. Water based
3.1.2.3. Hot-melt
3.1.2.4. Other
4. Pressure Sensitive Adhesives by Chemistry with their applications
4.1. Acrylic PSA
4.1.1. Introduction
4.1.2. Current market for 2016 by applications across North America, Europe, Asia, RoW
4.1.2.1. Automotive and transportation
4.1.2.2. Electrical & Electronics
4.1.2.3. Packaging
4.1.2.4. Aerospace
4.1.2.5. Medical
4.1.2.6. Building and construction
4.1.2.7. Others
4.1.3. Forecast from 2017 to 2022 by applications across North America, Europe, Asia, RoW
4.1.3.1. Automotive and transportation
4.1.3.2. Electrical & Electronics
4.1.3.3. Packaging
4.1.3.4. Aerospace
4.1.3.5. Medical
4.1.3.6. Building and construction
4.1.3.7. Others
4.1.4. Key growth drivers
4.1.5. Constraints
4.2. Rubber PSA
4.2.1. Introduction
4.2.2. Current market for 2016 by applications across North America, Europe, Asia, RoW
4.2.2.1. Electrical & Electronics
4.2.2.2. Building and construction
4.2.2.3. Automotive and transportation
4.2.2.4. Medical
4.2.2.5. Packaging
4.2.2.6. Aerospace
4.2.2.7. Others
4.2.3. Forecast from 2017 to 2022 by applications across North America, Europe, Asia, RoW
4.2.3.1. Electrical & Electronics
4.2.3.2. Building and construction
4.2.3.3. Automotive and transportation
4.2.3.4. Medical
4.2.3.5. Packaging
4.2.3.6. Aerospace
4.2.3.7. Others
4.2.4. Key growth drivers
4.2.5. Constraints
4.3. Silicone PSA
4.3.1. Introduction
4.3.2. Current market for 2016 by applications across North America, Europe, Asia, RoW
4.3.2.1. Electrical & Electronics
4.3.2.2. Medical
4.3.2.3. Industrial assembly
4.3.2.4. Aerospace
4.3.2.5. Others
4.3.3. Forecast from 2017 to 2022 by applications across North America, Europe, Asia, RoW
4.3.3.1. Electrical & Electronics
4.3.3.2. Medical
4.3.3.3. Industrial assembly
4.3.3.4. Aerospace
4.3.3.5. Others
4.3.4. Key growth drivers
4.3.5. Constraints
4.4. EVA PSA
4.4.1. Introduction
4.4.2. Current market for 2016 by applications across North America, Europe, Asia, RoW
4.4.2.1. General assembly
4.4.2.2. HVAC
4.4.2.3. Packaging
4.4.2.4. Others
4.4.3. Forecast from 2017 to 2022 by applications across North America, Europe, Asia, RoW
4.4.3.1. General assembly
4.4.3.2. HVAC
4.4.3.3. Packaging
4.4.3.4. Others
4.4.4. Key growth drivers
4.4.5. Constraints
4.5. Hybrid PSA
4.5.1. Introduction
4.5.2. Current market for 2016 by applications across North America, Europe, Asia, RoW
4.5.2.1. Packaging
4.5.2.2. Aerospace
4.5.2.3. Medical
4.5.2.4. Solar
4.5.2.5. Others
4.5.3. Forecast from 2017 to 2022 by applications across North America, Europe, Asia, RoW
4.5.3.1. Packaging
4.5.3.2. Aerospace
4.5.3.3. Medical
4.5.3.4. Solar
4.5.3.5. Others
4.5.4. Key growth drivers
4.5.5. Constraints
4.6. Other PSAs
4.6.1. Introduction
4.6.2. Current market for 2016 by applications across North America, Europe, Asia, RoW
4.6.2.1. Building & Construction
4.6.2.2. Packaging
4.6.2.3. Electrical & Electronics
4.6.2.4. Automotive & Transportation
4.6.2.5. Others
4.6.3. Forecast from 2017 to 2022 by applications across North America, Europe, Asia, RoW
4.6.3.1. Building & Construction
4.6.3.2. Packaging
4.6.3.3. Electrical & Electronics
4.6.3.4. Automotive & Transportation
4.6.3.5. Others
4.6.4. Key growth drivers
4.6.5. Constraints
5. Competitive benchmarking*
5.1. Company 1 (same parameters to be repeated for all the companies )
5.1.1. Company introduction
5.1.2. SWOT analysis in terms of Boron Nitride
5.1.3. Financials*
5.1.4. Employee and R&D details**
5.1.5. Products offerings
5.1.6. Plant locations
5.1.7. Installed capacity and utilisation rates
5.1.7.1. Capacity expansion plans
5.1.7.2. Capacity shares
5.1.7.3. Market shares
5.1.8. Strategic imperatives
5.1.9. Key Players
5.1.9.1. Americas, Europe & Asia (exc. China)
5.1.9.1.1. Henkel
5.1.9.1.2. ITW-Devcon
5.1.9.1.3. Avery Dennison
5.1.9.1.4. Bostik
5.1.9.1.5. HB Fuller
5.1.9.1.6. 3M
5.1.9.1.7. Forbo
5.1.9.1.8. Geistlich Ligamenta AG
5.1.9.1.9. Gludan Deutscheland GmbH
5.1.9.1.10. Jowat Adhesives
5.1.9.1.11. Keyser & Mackay
5.1.9.1.12. Collodin Chemie
5.1.9.1.13. Kleiberit
5.1.9.1.14. Kraton Polmers Nederlands
5.1.9.1.15. Collano
5.1.9.1.16. ALFA Klebstoffe AG
5.1.9.1.17. Ardex GmbH
5.1.9.1.18. ATO Adhesive Systems
5.1.9.1.19. Bodo Moller Chemie
5.1.9.1.20. Bolton Adhesives
5.1.9.1.21. Cabot Corporation
5.1.9.1.22. Ceroplats Technise Klebebander GmbH
5.1.9.1.23. CHT R. Beitlich GmbH
5.1.9.1.24. CTA GmbH
5.1.9.1.25. EUKALIN Spezial-Kelbstoff Fabrik GmbH
5.1.9.1.26. Alberdingk Boley
5.1.9.1.27. Sika
5.1.9.1.28. Organik Kimya Nederlands B. V.
5.1.9.1.29. Planatol Wetzell
5.1.9.1.30. PRHO-Chem GmbH
5.1.9.1.31. Rhenocoll-Werk e.K.
5.1.9.1.32. SABA Adhesives
5.1.9.1.33. SIEMA Industrieklebstoffe GmbH
5.1.9.1.34. Toyo Ink
5.1.9.1.35. Adhesives Research
5.1.9.1.36. Tremco Illbruck GmbH & Co. KG
5.1.9.1.37. Franklin Adhesives
5.1.9.1.38. Worthen Industries (U.S.)
5.1.9.1.39. Dow Corning (U.S.)
5.1.9.1.40. Shin Etsu (Japan)
5.1.9.1.41. Dymax
5.1.9.1.42. Dyna-tech
5.1.9.1.43. NuSil
5.1.9.1.44. Ashland
5.1.9.1.45. UHU Profi
5.1.9.1.46. Uzin UTZ AG
5.1.9.1.47. Silicon Valley Adhesive Corp.
5.1.9.1.48. Von Roll
5.1.9.1.49. Fastel Adhesives
5.1.9.1.50. KCC Corporation
5.1.9.1.51. Novamelt
5.1.9.1.52. Ter Hell & Co. GmbH
5.1.9.1.53. Paramelt
5.1.9.1.54. Vanavil S.p.A.
5.1.9.1.55. Vito Irmen GmbH & Co. KG
5.1.9.1.56. Weiss Chemie+Technik GmbH & Co. KG
5.1.9.2. China
5.1.9.2.1. Beijing Donglian Chemical Co. Ltd.
5.1.9.2.2. Beijing Eastern Acrylic Chemical Technology Co. Ltd.
5.1.9.2.3. Dongtai City Huale Rubber Industry Co.Ltd
5.1.9.2.4. Dongying City Jinyoulai Industry and Trade Co.Ltd
5.1.9.2.5. Hangzhou Wanli Synthetic Organic Chemical Co.Ltd
5.1.9.2.6. Hebei Jinliji Chemical Group
5.1.9.2.7. Jiangyin City Standard Rubberizing Material Factory
5.1.9.2.8. Jilin Huafeng Organs Silicon Co. Ltd.
5.1.9.2.9. Putian City Xinbang Adhesive Product Co. ,Ltd.
5.1.9.2.10. Qingzhou Riyue Chemical Co.Ltd.
5.1.9.2.11. Shandong Beifang Xiandai Chemical Industry Co.Ltd
5.1.9.2.12. Shandong Jiulong Polymer Materials Co.Ltd
5.1.9.2.13. Wuxi City Wanli Adhesive Material Co.Ltd
5.1.9.2.14. Yingkou Xinghuo Chemical Co. Ltd.
5.1.9.2.15. Yixing City Guanghui Adhesive Chemical Factory
6. Conclusion
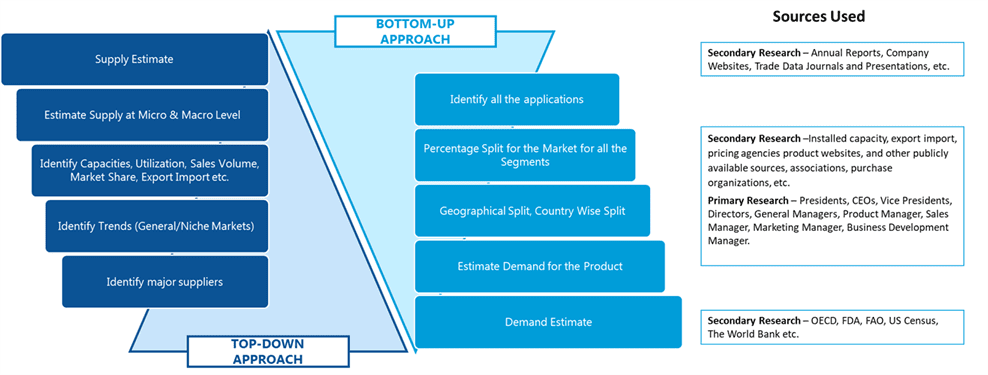
SDMR employs a three way data triangulation approach to arrive at market estimates. We use primary research, secondary research and data triangulation by top down and bottom up approach
Secondary Research:
Our research methodology involves in-depth desk research using various secondary sources. Data is gathered from association/government publications/databases, company websites, press releases, annual reports/presentations/sec filings, technical papers, journals, research papers, magazines, conferences, tradeshows, and blogs.
Key Data Points through secondary research-
Macro-economic data points
Import Export data
Identification of major market trends across various applications
Primary understanding of the industry for both the regions
Competitors analysis for the production capacities, key production sites, competitive landscape
Key customers
Production Capacity
Pricing Scenario
Cost Margin Analysis
Key Data Points through primary research-
Major factors driving the market and its end application markets
Comparative analysis and customer analysis
Regional presence
Collaborations or tie-ups
Annual Production, and sales
Profit Margins
Average Selling Price
Data Triangulation:
Data triangulation is done using top down and bottom approaches. However, to develop accurate market sizing estimations, both the methodologies are used to accurately arrive at the market size. Insert Image
