The research of Emollients, Film formers, Moisturizer Chemicals used in Cosmetics market mainly focuses on North America, Europe, Asia (excluding and China) and China covering:
Market participants of Emollients, Film formers, Moisturizer Chemicals used in Cosmetics:
Producers (active, potential producers)
End users
Raw material suppliers
Major traders
Application areas
Emollients, film formers and moisturizer chemicals in cosmetic applications
Market analysis
Capacity
Production
Consumption trends and forecast
Value chain analysis
Price analysis
Regions / countries
North America
Western Europe
Asia pacific excluding China
China
How this report will add value to your organisation
This report provides the in-depth analysis of the complete value chain from the raw material suppliers to the end users. We have critically analysed following parameters and their impact in the industry:
1. Improvement in top line and bottom line growth
Analysis trend & forecasts by end use markets will help you to understand how the growth in consumption is expected in next 5 years and what will be the key factors that will support the growth. This will help to make a clear plan for the top line growth. Price analytics will also play a crucial role in making a plan for top line growth.
Raw material and other input factors analysis will help to plan effectively for the bottom line.
2. Competitive intelligence
In a competitive marketplace, up-to-date information can make the difference between keeping pace, getting ahead, or being left behind. A smart intelligence operation can serve as an early-warning system for disruptive changes in the competitive landscape, whether that change is a rival's new product or pricing strategy or the entrance of an unexpected player into your market.
We also provide you with information that allows you to anticipate what your competitors are planning next. For example, you might gain information on a new product they are getting ready to launch or new services they will add to the business. Hiring us to handle this information collection saves you time and energy, allowing you to focus on your own business while still gaining the necessary knowledge to keep track of competitors.
3. Identification of prospective customers and their satisfaction level with the current supplier:
We have provided the long list of customers and analysed them critically, based on various parameters such as consumption, market type, sustainable business etc. this will help your organisation to develop relations with the consumers. Also, we have identified the factors in which the others customer will switch to you.
Methodology and sources
We follow the following steps to complete the report:
Desk research
Market size, capacity and production information are based on the following:
The sources of desk research are various, including published magazines, journals, government statistics, industrial statistics, customs statistics, association seminars as well as information from the Internet.
A lot of work goes into compilation and analysis of the obtained information.
Analysis of import & export data
Preliminary analysis of import & export situation in order to:
Evaluate the import & export situation
Evaluate the role of overseas products in domestic market
Evaluate the role of Indian products in international market.
Primary research
We carry out extensive telephone interviews across the value chain in order to survey the actual market situation. The interviewees we covered are:
Major producers
Major customers
Key traders
Raw materials suppliers
Industry associations
Bottom-up research
According to telephone interviews, matrix excel is designed to deal with complicated and abundant data that are mainly about capacity, output and consumption. Based on the consumption data for 2016 and future demand data from 2017 to 2022 is forecasted with the method of bottom-up research.
Report generation
Logical analysis and scientific ratiocination will be conducted to generate the report. All the data and findings obtained in the above stages are presented in the report clearly.
In this report, we have provided the detailed analysis of more than 80 companies which produce / supply different types of cosmetic chemicals
1. Executive summary
2. Brief Introduction of cosmetic chemicals industry
2.1. Overview
2.2. Product Identification
2.3. Brief overview of global cosmetic chemicals industry by following categories:
2.3.1. Emollients, film formers and moisturizers
2.3.2. Surfactants
2.3.3. Thickening agents
2.3.4. Colorants and pearlescent pigments
2.3.5. Preservatives
2.3.6. Carriers and Powders
2.3.7. Hair Conditioning Polymers
2.3.8. Hair Setting Resins
2.3.9. Antiperspirants and Deodorants
2.3.10. Sunscreen Chemicals
2.3.11. Antidandruff Agents
2.4. Value chain analysis
2.5. Porter five forces analysis of cosmetic chemicals market
2.6. Burning issues in the market such as regulations
2.7. Market dynamics
2.8. Raw material analysis
2.9. Policy and regulations
3. Global market analysis for Emollients, Film formers, Moisturizer Chemicals used in Cosmetics
3.1. Current market analysis for the year 2016
3.1.1. Polyols
3.1.1.1. Sorbitol
3.1.1.2. Glycerine
3.1.1.3. PEG
3.1.1.4. Propylene Glycol
3.1.1.5. Others
3.1.2. Hydrocarbons
3.1.2.1. White Oil / Paraffin Liquid
3.1.2.2. Petroleum Jellies
3.1.2.3. Microcrystalline wax
3.1.2.4. Squalane
3.1.3. Others
3.1.3.1. Silicones
3.1.3.2. Lanolin & derivatives
3.1.3.3. Esters
3.1.3.4. Natural wax
3.1.3.5. Fatty Alcohols
3.1.3.6. Fatty Acids
3.1.3.7. Triglycerides
3.1.3.8. Amino Acids and Polypeptides
3.1.3.9. Alkoxylates
3.1.3.10. Others
3.2. Forecast from 2017 to 2022
3.2.1. Polyols
3.2.1.1. Sorbitol
3.2.1.2. Glycerine
3.2.1.3. PEG
3.2.1.4. Propylene Glycol
3.2.1.5. Others
3.2.2. Hydrocarbons
3.2.2.1. White Oil / Paraffin Liquid
3.2.2.2. Petroleum Jellies
3.2.2.3. Microcrystalline wax
3.2.2.4. Squalane
3.2.3. Others
3.2.3.1. Silicones
3.2.3.2. Lanolin & derivatives
3.2.3.3. Esters
3.2.3.4. Natural wax
3.2.3.5. Fatty Alcohols
3.2.3.6. Fatty Acids
3.2.3.7. Triglycerides
3.2.3.8. Amino Acids and Polypeptides
3.2.3.9. Alkoxylates
3.2.3.10. Others
3.2.4. Key growth drivers
3.2.5. Key challenges
4. North America market analysis for Emollients, Film formers, Moisturizer Chemicals used in Cosmetics
4.1. Current market analysis for the year 2016
4.1.1. Polyols
4.1.1.1. Sorbitol
4.1.1.2. Glycerine
4.1.1.3. PEG
4.1.1.4. Propylene Glycol
4.1.1.5. Others
4.1.2. Hydrocarbons
4.1.2.1. White Oil / Paraffin Liquid
4.1.2.2. Petroleum Jellies
4.1.2.3. Microcrystalline wax
4.1.2.4. Squalane
4.1.3. Others
4.1.3.1. Silicones
4.1.3.2. Lanolin & derivatives
4.1.3.3. Esters
4.1.3.4. Natural wax
4.1.3.5. Fatty Alcohols
4.1.3.6. Fatty Acids
4.1.3.7. Triglycerides
4.1.3.8. Amino Acids and Polypeptides
4.1.3.9. Alkoxylates
4.1.3.10. Others
4.2. Forecast from 2017 to 2022
4.2.1. Polyols
4.2.1.1. Sorbitol
4.2.1.2. Glycerine
4.2.1.3. PEG
4.2.1.4. Propylene Glycol
4.2.1.5. Others
4.2.2. Hydrocarbons
4.2.2.1. White Oil / Paraffin Liquid
4.2.2.2. Petroleum Jellies
4.2.2.3. Microcrystalline wax
4.2.2.4. Squalane
4.2.3. Others
4.2.3.1. Silicones
4.2.3.2. Lanolin & derivatives
4.2.3.3. Esters
4.2.3.4. Natural wax
4.2.3.5. Fatty Alcohols
4.2.3.6. Fatty Acids
4.2.3.7. Triglycerides
4.2.3.8. Amino Acids and Polypeptides
4.2.3.9. Alkoxylates
4.2.3.10. Others
4.2.4. Key growth drivers
4.2.5. Key challenges
5. European market analysis for Emollients, Film formers, Moisturizer Chemicals used in Cosmetics
5.1. Current market analysis for the year 2016
5.1.1. Polyols
5.1.1.1. Sorbitol
5.1.1.2. Glycerine
5.1.1.3. PEG
5.1.1.4. Propylene Glycol
5.1.1.5. Others
5.1.2. Hydrocarbons
5.1.2.1. White Oil / Paraffin Liquid
5.1.2.2. Petroleum Jellies
5.1.2.3. Microcrystalline wax
5.1.2.4. Squalane
5.1.3. Others
5.1.3.1. Silicones
5.1.3.2. Lanolin & derivatives
5.1.3.3. Esters
5.1.3.4. Natural wax
5.1.3.5. Fatty Alcohols
5.1.3.6. Fatty Acids
5.1.3.7. Triglycerides
5.1.3.8. Amino Acids and Polypeptides
5.1.3.9. Alkoxylates
5.1.3.10. Others
5.2. Forecast from 2017 to 2022
5.2.1. Polyols
5.2.1.1. Sorbitol
5.2.1.2. Glycerine
5.2.1.3. PEG
5.2.1.4. Propylene Glycol
5.2.1.5. Others
5.2.2. Hydrocarbons
5.2.2.1. White Oil / Paraffin Liquid
5.2.2.2. Petroleum Jellies
5.2.2.3. Microcrystalline wax
5.2.2.4. Squalane
5.2.3. Others
5.2.3.1. Silicones
5.2.3.2. Lanolin & derivatives
5.2.3.3. Esters
5.2.3.4. Natural wax
5.2.3.5. Fatty Alcohols
5.2.3.6. Fatty Acids
5.2.3.7. Triglycerides
5.2.3.8. Amino Acids and Polypeptides
5.2.3.9. Alkoxylates
5.2.3.10. Others
5.2.4. Key growth drivers
5.2.5. Key challenges
6. China market analysis for Emollients, Film formers, Moisturizer Chemicals used in Cosmetics
6.1. Current market analysis for the year 2016
6.1.1. Polyols
6.1.1.1. Sorbitol
6.1.1.2. Glycerine
6.1.1.3. PEG
6.1.1.4. Propylene Glycol
6.1.1.5. Others
6.1.2. Hydrocarbons
6.1.2.1. White Oil / Paraffin Liquid
6.1.2.2. Petroleum Jellies
6.1.2.3. Microcrystalline wax
6.1.2.4. Squalane
6.1.3. Others
6.1.3.1. Silicones
6.1.3.2. Lanolin & derivatives
6.1.3.3. Esters
6.1.3.4. Natural wax
6.1.3.5. Fatty Alcohols
6.1.3.6. Fatty Acids
6.1.3.7. Triglycerides
6.1.3.8. Amino Acids and Polypeptides
6.1.3.9. Alkoxylates
6.1.3.10. Others
6.2. Forecast from 2017 to 2022
6.2.1. Polyols
6.2.1.1. Sorbitol
6.2.1.2. Glycerine
6.2.1.3. PEG
6.2.1.4. Propylene Glycol
6.2.1.5. Others
6.2.2. Hydrocarbons
6.2.2.1. White Oil / Paraffin Liquid
6.2.2.2. Petroleum Jellies
6.2.2.3. Microcrystalline wax
6.2.2.4. Squalane
6.2.3. Others
6.2.3.1. Silicones
6.2.3.2. Lanolin & derivatives
6.2.3.3. Esters
6.2.3.4. Natural wax
6.2.3.5. Fatty Alcohols
6.2.3.6. Fatty Acids
6.2.3.7. Triglycerides
6.2.3.8. Amino Acids and Polypeptides
6.2.3.9. Alkoxylates
6.2.3.10. Others
6.2.4. Key growth drivers
6.2.5. Key challenges
7. Asia Pacific (exc. China) market analysis for Emollients, Film formers, Moisturizer Chemicals used in Cosmetics
7.1. Current market analysis for the year 2016
7.1.1. Polyols
7.1.1.1. Sorbitol
7.1.1.2. Glycerine
7.1.1.3. PEG
7.1.1.4. Propylene Glycol
7.1.1.5. Others
7.1.2. Hydrocarbons
7.1.2.1. White Oil / Paraffin Liquid
7.1.2.2. Petroleum Jellies
7.1.2.3. Microcrystalline wax
7.1.2.4. Squalane
7.1.3. Others
7.1.3.1. Silicones
7.1.3.2. Lanolin & derivatives
7.1.3.3. Esters
7.1.3.4. Natural wax
7.1.3.5. Fatty Alcohols
7.1.3.6. Fatty Acids
7.1.3.7. Triglycerides
7.1.3.8. Amino Acids and Polypeptides
7.1.3.9. Alkoxylates
7.1.3.10. Others
7.2. Forecast from 2017 to 2022
7.2.1. Polyols
7.2.1.1. Sorbitol
7.2.1.2. Glycerine
7.2.1.3. PEG
7.2.1.4. Propylene Glycol
7.2.1.5. Others
7.2.2. Hydrocarbons
7.2.2.1. White Oil / Paraffin Liquid
7.2.2.2. Petroleum Jellies
7.2.2.3. Microcrystalline wax
7.2.2.4. Squalane
7.2.3. Others
7.2.3.1. Silicones
7.2.3.2. Lanolin & derivatives
7.2.3.3. Esters
7.2.3.4. Natural wax
7.2.3.5. Fatty Alcohols
7.2.3.6. Fatty Acids
7.2.3.7. Triglycerides
7.2.3.8. Amino Acids and Polypeptides
7.2.3.9. Alkoxylates
7.2.3.10. Others
7.2.4. Key growth drivers
7.2.5. Key challenges
8. Rest of the world market analysis for Emollients, Film formers, Moisturizer Chemicals used in Cosmetics
8.1. Current market analysis for the year 2016
8.1.1. Polyols
8.1.1.1. Sorbitol
8.1.1.2. Glycerine
8.1.1.3. PEG
8.1.1.4. Propylene Glycol
8.1.1.5. Others
8.1.2. Hydrocarbons
8.1.2.1. White Oil / Paraffin Liquid
8.1.2.2. Petroleum Jellies
8.1.2.3. Microcrystalline wax
8.1.2.4. Squalane
8.1.3. Others
8.1.3.1. Silicones
8.1.3.2. Lanolin & derivatives
8.1.3.3. Esters
8.1.3.4. Natural wax
8.1.3.5. Fatty Alcohols
8.1.3.6. Fatty Acids
8.1.3.7. Triglycerides
8.1.3.8. Amino Acids and Polypeptides
8.1.3.9. Alkoxylates
8.1.3.10. Others
8.2. Forecast from 2017 to 2022
8.2.1. Polyols
8.2.1.1. Sorbitol
8.2.1.2. Glycerine
8.2.1.3. PEG
8.2.1.4. Propylene Glycol
8.2.1.5. Others
8.2.2. Hydrocarbons
8.2.2.1. White Oil / Paraffin Liquid
8.2.2.2. Petroleum Jellies
8.2.2.3. Microcrystalline wax
8.2.2.4. Squalane
8.2.3. Others
8.2.3.1. Silicones
8.2.3.2. Lanolin & derivatives
8.2.3.3. Esters
8.2.3.4. Natural wax
8.2.3.5. Fatty Alcohols
8.2.3.6. Fatty Acids
8.2.3.7. Triglycerides
8.2.3.8. Amino Acids and Polypeptides
8.2.3.9. Alkoxylates
8.2.3.10. Others
8.2.4. Key growth drivers
8.2.5. Key challenges
9. Historical & forecast price analysis for the following regions
9.1. North America
9.2. Western Europe
9.3. Asia pacific excluding China
9.4. China
10. Analysis of key manufacturers of Emollients, Film formers, Moisturizer Chemicals used in Cosmetics *
10.1. Company 1
10.1.1. Company introduction
10.1.2. SWOT analysis in terms of Emollients, Film formers, Moisturizer Chemicals used in Cosmetics
10.1.3. Financials*
10.1.4. Employee and R&D details**
10.1.5. Products offerings
10.1.5.1. Emollients, Film formers, Moisturizer Chemicals used in Cosmetics
10.1.5.2. Other products
10.1.6. Plant locations
10.1.6.1. Details of Emollients, Film formers, Moisturizer Chemicals used in Cosmetics plant
10.1.7. Installed capacity of Emollients, Film formers, Moisturizer Chemicals used in Cosmetics
10.1.7.1. Capacity expansion plans
10.1.7.2. Capacity shares of Emollients, Film formers, Moisturizer Chemicals used in Cosmetics
10.1.8. Strategic imperatives
10.2. Same parameters as above will be repeated for the following companies across:
10.2.1. North America
10.2.1.1. Archer Daniels Midland Co.
10.2.1.2. Arizona Chemical Company
10.2.1.3. Cognis Corporation
10.2.1.4. Corn Products International
10.2.1.5. Croda
10.2.1.6. Elementis Specialties
10.2.1.7. Inolex Chemical Company
10.2.1.8. ISP
10.2.1.9. Lipo Chemicals
10.2.1.10. Lonza
10.2.1.11. LyondellBasell Industries
10.2.1.12. Momentive Performance Materials Inc.
10.2.1.13. RITA Corporation
10.2.1.14. Roquette America, Inc.
10.2.1.15. Sasol North America
10.2.1.16. Shin-Etsu Silicones of America
10.2.1.17. Stepan Company
10.2.1.18. The Procter & Gamble Company
10.2.1.19. Wacker Chemical Corporation
10.2.1.20. Vantage Chemicals
10.2.2. Western Europe
10.2.2.1. AarhusKarlshamn AB
10.2.2.2. Aiglon SA
10.2.2.3. Akzo Nobel
10.2.2.4. BASF
10.2.2.5. Cargill
10.2.2.6. Clariant
10.2.2.7. CLR Chemical Laboratorium
10.2.2.8. Cognis
10.2.2.9. Croda
10.2.2.10. Dow Chemical
10.2.2.11. DSM
10.2.2.12. Fuchs Lubricants
10.2.2.13. Gattefossé
10.2.2.14. Kelisema
10.2.2.15. Kolb
10.2.2.16. Lakeoil
10.2.2.17. Lanolines de la Tossee
10.2.2.18. Momentive Performance Materials
10.2.2.19. Oleon NV
10.2.2.20. Roquette Frères
10.2.2.21. Sasol Olefins & Surfactants GmbH
10.2.2.22. SEPPIC
10.2.2.23. Solvay SA
10.2.2.24. Sonneborn
10.2.2.25. Sophim
10.2.2.26. Stearinerie Dubois
10.2.2.27. Wacker Chemie
10.2.3. Asia Pacific
10.2.3.1. ADEKA Corporation
10.2.3.2. Asahi Glass Company
10.2.3.3. Basic Chemical Industry Limited
10.2.3.4. Bussan Fine Chemical Co., Ltd.
10.2.3.5. Chuo Kasei Company Limited
10.2.3.6. Cisadane Raya Chemical
10.2.3.7. Croda Japan
10.2.3.8. Daicel Chemical Industries
10.2.3.9. Domas Agrointi Prima
10.2.3.10. Ecogreen Oleochemicals
10.2.3.11. Emery Oleochemicals Sdn. Bhd. ,
10.2.3.12. Food Chemifa Co., Ltd.
10.2.3.13. Guangdong Guangzhou Litze
10.2.3.14. H.K. Finechem Limited
10.2.3.15. Jilin Petrochemical Company
10.2.3.16. Kaneda Limited
10.2.3.17. Kokyu Alcohol Kogyo Co., Ltd
10.2.3.18. Lion Corporation
10.2.3.19. Matsumura Oil Research Corporation
10.2.3.20. Mitsui Chemicals
10.2.3.21. Miyoshi Oil & Fat Co., Ltd.
10.2.3.22. New Japan Chemical Co., Ltd.
10.2.3.23. Nikko Chemicals Co., Ltd.
10.2.3.24. Nikko Rika Corporation
10.2.3.25. Nippon Fine Chemical Co., Ltd.
10.2.3.26. Nissan Chemical Industries, Ltd
10.2.3.27. NOF Corporation
10.2.3.28. Pan-Century Oleochemicals Sdn. Bhd.
10.2.3.29. Pilipinas Kao
10.2.3.30. Raj Agro Mills
10.2.3.31. Sakamoto Orient Chemicals Corporation
10.2.3.32. Shanghai Goodway Chemical
10.2.3.33. Shanghai Jing Di Chemical
10.2.3.34. Shanghai Jinshan Jingwei Chemical
10.2.3.35. Shinei Kagaku K.K.
10.2.3.36. Tianjin Henkel
10.2.3.37. Tianjin Tian Zhi Fine Chemical
10.2.3.38. VVF Limited
10.2.3.39. Wings Surya
11. Conclusion
SDMR employs a three way data triangulation approach to arrive at market estimates. We use primary research, secondary research and data triangulation by top down and bottom up approach
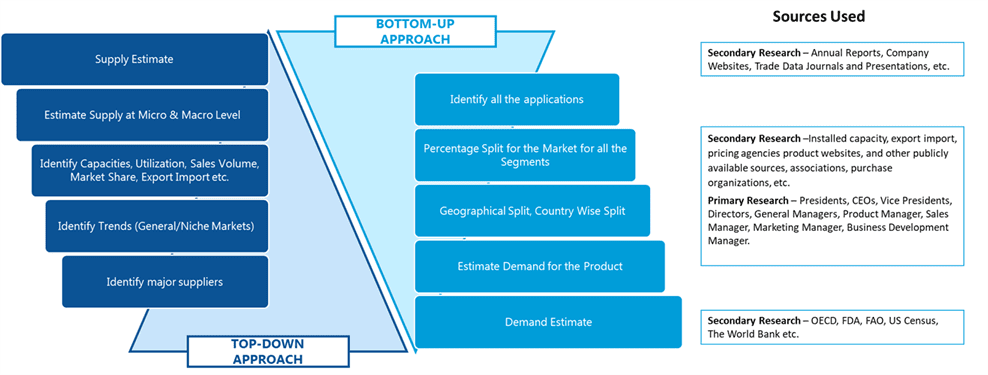
Secondary Research:
Our research methodology involves in-depth desk research using various secondary sources. Data is gathered from association/government publications/databases, company websites, press releases, annual reports/presentations/sec filings, technical papers, journals, research papers, magazines, conferences, tradeshows, and blogs.
Key Data Points through secondary research-
Macro-economic data points
Import Export data
Identification of major market trends across various applications
Primary understanding of the industry for both the regions
Competitors analysis for the production capacities, key production sites, competitive landscape
Key customers
Production Capacity
Pricing Scenario
Cost Margin Analysis
Key Data Points through primary research-
Major factors driving the market and its end application markets
Comparative analysis and customer analysis
Regional presence
Collaborations or tie-ups
Annual Production, and sales
Profit Margins
Average Selling Price
Data Triangulation:
Data triangulation is done using top down and bottom approaches. However, to develop accurate market sizing estimations, both the methodologies are used to accurately arrive at the market size. Insert Image
