Instrumentation valve and fittings market is dominated by oil & gas, food & beverages and chemicals industry. Instrumentation valve and fittings market is used in these industries to monitor and control the flow of media by adjusting flow rates of pipelines. Cyclical nature of oil & gas industry, reduction in Average Selling Prices, brand focused nature of industry and shrinking profit margins due to rising cost of raw materials restricting the growth of global instrumentation valves and fittings market. However, this market is expected to witness considerable demand traction in coming 6 years due to growth in fracking, rising production of oil & gas and chemical industries, increasing demand of aseptic instrumentation valves in pharma, semiconductor and medical industry.
APAC holds leading position in Instrumentation valve and fittings market, owing to huge chemical production plants in China and Japan. Developing economies of APAC like India and Taiwan will help this region to dominate its presence in instrumentation valve and fittings market. Semiconductor industry is expected to witness highest growth rate in instrumentation valve and fittings market. Increasing penetration of electronics devices and rise in semiconductor fabs and production plants will help this industry vertical to be key investment pocket for instrumentation valve and fittings market. As a result of such lucrative opportunities Taiwan and South Korea will be key countries for semiconductor related instrumentation valve and fittings market.
Circor, Hy-lok, Swagelok, Ham-Let and Parker Hannifin are leading players of instrumentation valve and fittings market. Key strategies adopted by these players are new product development and business expansion. In next 6 years, increasing R&D investments will be the key strategy for key industry players of instrumentation valve and fittings market.
TABLE OF CONTENTS
1. Introduction
1.1. Objective of Study
1.2. Market Definition
1.3. Geographic Scope
1.4. Market segmentation
2. Research Methodology
2.1. Research Design
2.2. Market size Estimation
2.3. Research Assumptions & Limitations
3. Executive Summary
4. Market Overview
4.1. Instrumentation Valves & Fittings Market trend
4.2. Value chain Analysis
4.3. Market Dynamics ( Drivers , Restraints , Opportunities & Challenges )
5. Market by Valves Product type
5.1. Introduction
5.2. Ball Valves
5.3. Needle Valves
5.4. Toggle Valves
5.5. Ultra clean Valves
5.6. Manifold Valves
5.7. Others
6. Market by Fittings Product type
6.1. Introduction
6.2. Single Ferrule
6.3. Double Ferrule
6.4. Pipe Fittings
6.5. Flare Fittings
6.6. Others
7. Instrumentation Valves & Fittings Market by Applications
7.1. Introduction
7.2. Oil & Gas
7.3. Chemical
7.4. Water/Waste Water
7.5. Food & Beverage
7.6. Power
7.7. Semiconductors
7.8. Pharmaceuticals
7.9. Hyperbaric chambers
7.10. Others
8. Instrumentation Valves & Fittings Market, By Geography
8.1. North America
8.1.1. USA
8.1.2. Canada
8.1.3. Mexico
8.2. Europe
8.2.1. United Kingdom
8.2.2. Germany
8.2.3. France
8.2.4. Rest of Europe
8.3. Asia Pacific
8.3.1. China
8.3.2. India
8.3.3. Australia
8.3.4. Rest of Asia Pacific
8.4. ROW (Rest of the World)
8.4.1. Middle East
8.4.2. Africa
8.4.3. Egypt
8.4.4. Others
9. Competitive Landscape
9.1.1. Market Share Analysis
9.1.2. Acquisitions & Mergers
9.1.3. New Product Launch
9.1.4. Expansions
10. Company Profile
10.1.1. Swagelok
10.1.2. SSP Fittings
10.1.3. Parker Hannifin
10.1.4. As-Schneider
10.1.5. Hoke ( Circor )
10.1.6. Hy-Lok
10.1.7. Safelok
10.1.8. Fujikin
10.1.9. Fitok
10.1.10. Others
SDMR employs a three way data triangulation approach to arrive at market estimates. We use primary research, secondary research and data triangulation by top down and bottom up approach
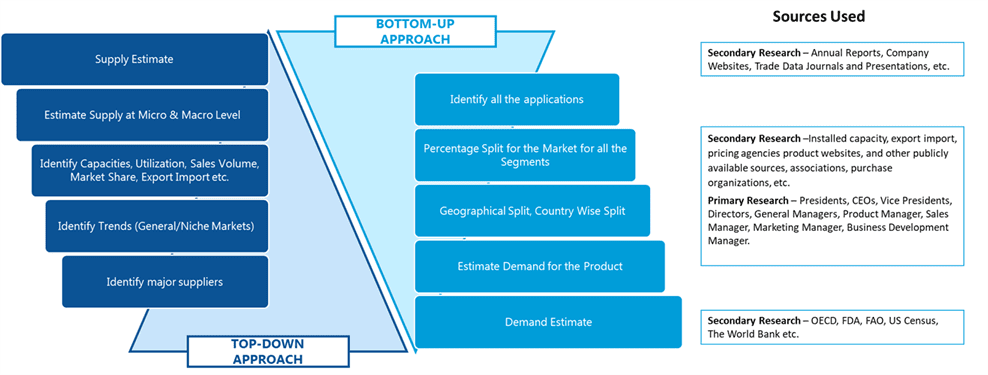
Secondary Research:
Our research methodology involves in-depth desk research using various secondary sources. Data is gathered from association/government publications/databases, company websites, press releases, annual reports/presentations/sec filings, technical papers, journals, research papers, magazines, conferences, tradeshows, and blogs.
Key Data Points through secondary research-
Macro-economic data points
Import Export data
Identification of major market trends across various applications
Primary understanding of the industry for both the regions
Competitors analysis for the production capacities, key production sites, competitive landscape
Key customers
Production Capacity
Pricing Scenario
Cost Margin Analysis
Key Data Points through primary research-
Major factors driving the market and its end application markets
Comparative analysis and customer analysis
Regional presence
Collaborations or tie-ups
Annual Production, and sales
Profit Margins
Average Selling Price
Data Triangulation:
Data triangulation is done using top down and bottom approaches. However, to develop accurate market sizing estimations, both the methodologies are used to accurately arrive at the market size. Insert Image
