The use of interconnected devices with real time data collaboration within the insurance industry is known as Internet of Things (IoT) insurance. The IoT enabled devices help insurer provide data, which can be used to manage claims, reduce risk, and identify various frauds. Easy settlement of claims, creation of analytical value from obtained data, and development of flexible insurance products for various sectors of the market are some of the advantages of IoT in insurance technology. The privacy of the user identity and over dependency on technology limit the adoption of IoT in insurance.
The growth in inclination towards IoT and increased demand for IoT-based devices in insurance industry majorly drive the IoT insurance market. Further, growth in practice of cloud computing in insurance sector and improved insurance service owing to adoption of IoT also propel the market toward growth. Development of new insurance model based on smart devices, growth in need to insure the devices such as smart automobiles, and analytics based on data provided by IoT devices for improvement of business creates sufficient opportunities in the IoT insurance market.
In 2018, the global Internet of Things Insurance market size was xx million US$ and it is expected to reach xx million US$ by the end of 2025, with a CAGR of xx% during 2019-2025.
This report focuses on the global Internet of Things Insurance status, future forecast, growth opportunity, key market and key players. The study objectives are to present the Internet of Things Insurance development in United States, Europe and China.
The key players covered in this study
IBM Corporation
SAP SE
Oracle Corporation
Google
Microsoft Corporation
Cisco System
Accenture PLC
Verisk Analytics
Concirrus
Zonoff
Market segment by Type, the product can be split into
Property & Casualty Insurance
Health Insurance
Life Insurance
Others
Market segment by Application, split into
Automotive & Transportation
Home & Commercial Building
Life & Health
Business & Enterprise
Travel
Others
Market segment by Regions/Countries, this report covers
United States
Europe
China
Japan
Southeast Asia
India
Central & South America
The study objectives of this report are:
To analyze global Internet of Things Insurance status, future forecast, growth opportunity, key market and key players.
To present the Internet of Things Insurance development in United States, Europe and China.
To strategically profile the key players and comprehensively analyze their development plan and strategies.
To define, describe and forecast the market by product type, market and key regions.
In this study, the years considered to estimate the market size of Internet of Things Insurance are as follows:
History Year: 2014-2018
Base Year: 2018
Estimated Year: 2019
Forecast Year 2019 to 2025
For the data information by region, company, type and application, 2018 is considered as the base year. Whenever data information was unavailable for the base year, the prior year has been considered.
Table of Contents
1 Report Overview
1.1 Study Scope
1.2 Key Market Segments
1.3 Players Covered
1.4 Market Analysis by Type
1.4.1 Global Internet of Things Insurance Market Size Growth Rate by Type (2014-2025)
1.4.2 Property & Casualty Insurance
1.4.3 Health Insurance
1.4.4 Life Insurance
1.4.5 Others
1.5 Market by Application
1.5.1 Global Internet of Things Insurance Market Share by Application (2014-2025)
1.5.2 Automotive & Transportation
1.5.3 Home & Commercial Building
1.5.4 Life & Health
1.5.5 Business & Enterprise
1.5.6 Travel
1.5.7 Others
1.6 Study Objectives
1.7 Years Considered
2 Global Growth Trends
2.1 Internet of Things Insurance Market Size
2.2 Internet of Things Insurance Growth Trends by Regions
2.2.1 Internet of Things Insurance Market Size by Regions (2014-2025)
2.2.2 Internet of Things Insurance Market Share by Regions (2014-2019)
2.3 Industry Trends
2.3.1 Market Top Trends
2.3.2 Market Drivers
2.3.3 Market Opportunities
3 Market Share by Key Players
3.1 Internet of Things Insurance Market Size by Manufacturers
3.1.1 Global Internet of Things Insurance Revenue by Manufacturers (2014-2019)
3.1.2 Global Internet of Things Insurance Revenue Market Share by Manufacturers (2014-2019)
3.1.3 Global Internet of Things Insurance Market Concentration Ratio (CR5 and HHI)
3.2 Internet of Things Insurance Key Players Head office and Area Served
3.3 Key Players Internet of Things Insurance Product/Solution/Service
3.4 Date of Enter into Internet of Things Insurance Market
3.5 Mergers & Acquisitions, Expansion Plans
4 Breakdown Data by Type and Application
4.1 Global Internet of Things Insurance Market Size by Type (2014-2019)
4.2 Global Internet of Things Insurance Market Size by Application (2014-2019)
5 United States
5.1 United States Internet of Things Insurance Market Size (2014-2019)
5.2 Internet of Things Insurance Key Players in United States
5.3 United States Internet of Things Insurance Market Size by Type
5.4 United States Internet of Things Insurance Market Size by Application
6 Europe
6.1 Europe Internet of Things Insurance Market Size (2014-2019)
6.2 Internet of Things Insurance Key Players in Europe
6.3 Europe Internet of Things Insurance Market Size by Type
6.4 Europe Internet of Things Insurance Market Size by Application
7 China
7.1 China Internet of Things Insurance Market Size (2014-2019)
7.2 Internet of Things Insurance Key Players in China
7.3 China Internet of Things Insurance Market Size by Type
7.4 China Internet of Things Insurance Market Size by Application
8 Japan
8.1 Japan Internet of Things Insurance Market Size (2014-2019)
8.2 Internet of Things Insurance Key Players in Japan
8.3 Japan Internet of Things Insurance Market Size by Type
8.4 Japan Internet of Things Insurance Market Size by Application
9 Southeast Asia
9.1 Southeast Asia Internet of Things Insurance Market Size (2014-2019)
9.2 Internet of Things Insurance Key Players in Southeast Asia
9.3 Southeast Asia Internet of Things Insurance Market Size by Type
9.4 Southeast Asia Internet of Things Insurance Market Size by Application
10 India
10.1 India Internet of Things Insurance Market Size (2014-2019)
10.2 Internet of Things Insurance Key Players in India
10.3 India Internet of Things Insurance Market Size by Type
10.4 India Internet of Things Insurance Market Size by Application
11 Central & South America
11.1 Central & South America Internet of Things Insurance Market Size (2014-2019)
11.2 Internet of Things Insurance Key Players in Central & South America
11.3 Central & South America Internet of Things Insurance Market Size by Type
11.4 Central & South America Internet of Things Insurance Market Size by Application
12 International Players Profiles
12.1 IBM Corporation
12.1.1 IBM Corporation Company Details
12.1.2 Company Description and Business Overview
12.1.3 Internet of Things Insurance Introduction
12.1.4 IBM Corporation Revenue in Internet of Things Insurance Business (2014-2019)
12.1.5 IBM Corporation Recent Development
12.2 SAP SE
12.2.1 SAP SE Company Details
12.2.2 Company Description and Business Overview
12.2.3 Internet of Things Insurance Introduction
12.2.4 SAP SE Revenue in Internet of Things Insurance Business (2014-2019)
12.2.5 SAP SE Recent Development
12.3 Oracle Corporation
12.3.1 Oracle Corporation Company Details
12.3.2 Company Description and Business Overview
12.3.3 Internet of Things Insurance Introduction
12.3.4 Oracle Corporation Revenue in Internet of Things Insurance Business (2014-2019)
12.3.5 Oracle Corporation Recent Development
12.4 Google
12.4.1 Google Company Details
12.4.2 Company Description and Business Overview
12.4.3 Internet of Things Insurance Introduction
12.4.4 Google Revenue in Internet of Things Insurance Business (2014-2019)
12.4.5 Google Recent Development
12.5 Microsoft Corporation
12.5.1 Microsoft Corporation Company Details
12.5.2 Company Description and Business Overview
12.5.3 Internet of Things Insurance Introduction
12.5.4 Microsoft Corporation Revenue in Internet of Things Insurance Business (2014-2019)
12.5.5 Microsoft Corporation Recent Development
12.6 Cisco System
12.6.1 Cisco System Company Details
12.6.2 Company Description and Business Overview
12.6.3 Internet of Things Insurance Introduction
12.6.4 Cisco System Revenue in Internet of Things Insurance Business (2014-2019)
12.6.5 Cisco System Recent Development
12.7 Accenture PLC
12.7.1 Accenture PLC Company Details
12.7.2 Company Description and Business Overview
12.7.3 Internet of Things Insurance Introduction
12.7.4 Accenture PLC Revenue in Internet of Things Insurance Business (2014-2019)
12.7.5 Accenture PLC Recent Development
12.8 Verisk Analytics
12.8.1 Verisk Analytics Company Details
12.8.2 Company Description and Business Overview
12.8.3 Internet of Things Insurance Introduction
12.8.4 Verisk Analytics Revenue in Internet of Things Insurance Business (2014-2019)
12.8.5 Verisk Analytics Recent Development
12.9 Concirrus
12.9.1 Concirrus Company Details
12.9.2 Company Description and Business Overview
12.9.3 Internet of Things Insurance Introduction
12.9.4 Concirrus Revenue in Internet of Things Insurance Business (2014-2019)
12.9.5 Concirrus Recent Development
12.10 Zonoff
12.10.1 Zonoff Company Details
12.10.2 Company Description and Business Overview
12.10.3 Internet of Things Insurance Introduction
12.10.4 Zonoff Revenue in Internet of Things Insurance Business (2014-2019)
12.10.5 Zonoff Recent Development
13 Market Forecast 2019-2025
13.1 Market Size Forecast by Regions
13.2 United States
13.3 Europe
13.4 China
13.5 Japan
13.6 Southeast Asia
13.7 India
13.8 Central & South America
13.9 Market Size Forecast by Product (2019-2025)
13.10 Market Size Forecast by Application (2019-2025)
14 Analyst's Viewpoints/Conclusions
15 Appendix
15.1 Research Methodology
15.1.1 Methodology/Research Approach
15.1.1.1 Research Programs/Design
15.1.1.2 Market Size Estimation
12.1.1.3 Market Breakdown and Data Triangulation
15.1.2 Data Source
15.1.2.1 Secondary Sources
15.1.2.2 Primary Sources
15.2 Disclaimer
15.3 Author Details
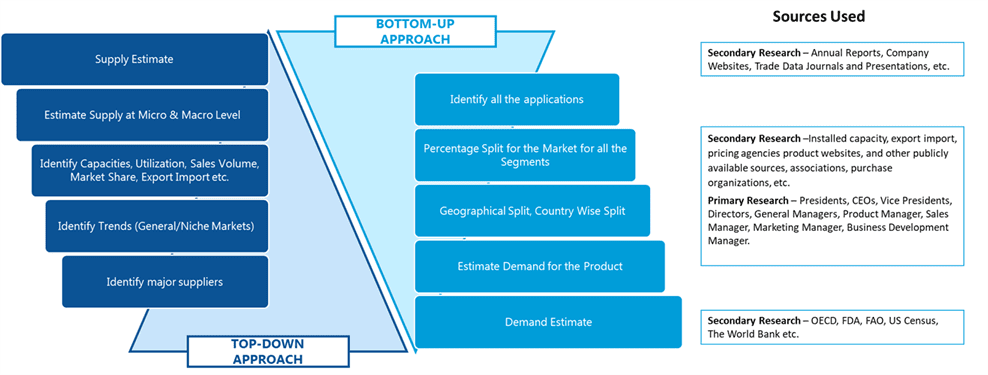
SDMR employs a three way data triangulation approach to arrive at market estimates. We use primary research, secondary research and data triangulation by top down and bottom up approach
Secondary Research:
Our research methodology involves in-depth desk research using various secondary sources. Data is gathered from association/government publications/databases, company websites, press releases, annual reports/presentations/sec filings, technical papers, journals, research papers, magazines, conferences, tradeshows, and blogs.
Key Data Points through secondary research-
Macro-economic data points
Import Export data
Identification of major market trends across various applications
Primary understanding of the industry for both the regions
Competitors analysis for the production capacities, key production sites, competitive landscape
Key customers
Production Capacity
Pricing Scenario
Cost Margin Analysis
Key Data Points through primary research-
Major factors driving the market and its end application markets
Comparative analysis and customer analysis
Regional presence
Collaborations or tie-ups
Annual Production, and sales
Profit Margins
Average Selling Price
Data Triangulation:
Data triangulation is done using top down and bottom approaches. However, to develop accurate market sizing estimations, both the methodologies are used to accurately arrive at the market size. Insert Image
